Executive Summary
Heightened Expense Challenges Hurt Healthcare Providers in 2021
2021 proved to be another challenging year for the nation’s healthcare providers, as hospitals, health systems, physician practices, and other healthcare organizations endured continued expense increases and unstable volumes and margins. The impacts of U.S. labor shortages amid the ongoing COVID-19 pandemic intensified in the latter half of the year, driving up hourly wages as organizations vied for a shrinking pool of qualified healthcare workers.
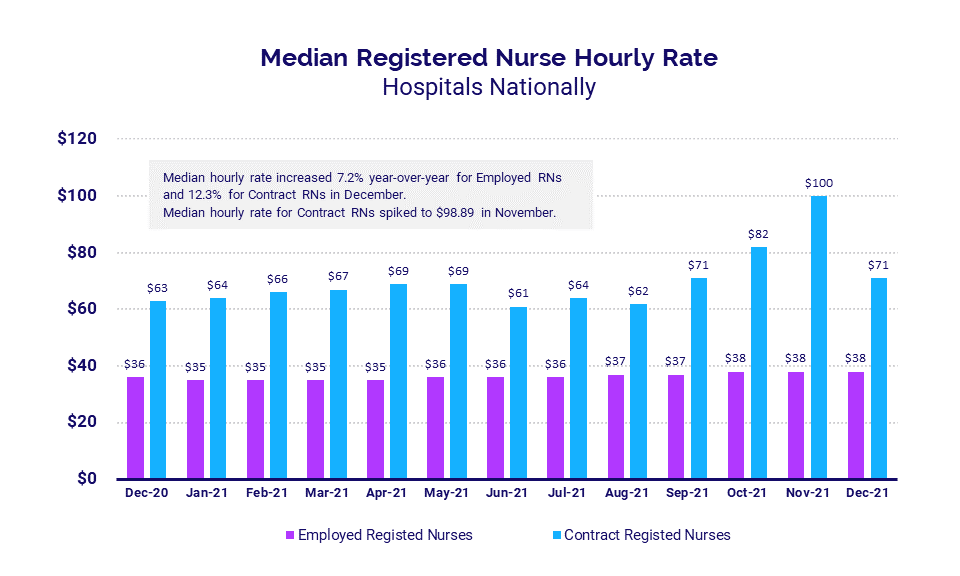
Many organizations were forced to rely heavily on contract and travel nurses to make up for deficient staffing levels, pushing median hourly rates for contract registered nurses as high as $100 per hour in November. Even for employed positions, hourly pay hikes for the year exceeded those seen in prior years. Respiratory Therapists, for example, remain in high demand due to large numbers of COVID-19 patients suffering respiratory conditions from the virus. Hourly rates for Respiratory Therapists jumped 10.3% from 2019 to 2021 as a result.
“Regardless of how well systems are managing their employees’ worked hours versus volume, attrition and heavy use of agency staff will add 30% plus cost to the labor expense,” said Matthew Thompson, Managing Director at Huron. “Organizations must understand that employees have options and move to innovative ways to source, grow, and retain talent. A measured and dedicated focus on culture will be a must. Non-traditional approaches for recognition and rewarding their employees will become a baseline standard. Forming partnerships and strategies to drive talent to the organization, instead of passively hoping to attract talent, will be critical.”
Hospitals and health systems saw both labor and non-labor expenses rise significantly throughout the year compared to 2019 and 2020 levels. In addition to workforce shortages, they were hit with steepening non-labor costs due in part to supply chain issues that are crippling industries around the globe.
Combined with continued low volumes relative to pre-pandemic levels, the higher expenses put immense pressure on hospital operating margins. Physicians face similar challenges, as mounting expenses push up investments needed to support insufficient practice revenues.
“The continuing — and in many ways intensifying — economic challenges of COVID threaten the ability of America’s hospitals and health systems to make greatly needed investments for long-term competitiveness and improved community health,” says Kenneth Kaufman, Chair of Kaufman Hall.
Read this month’s report for these and other trends in hospital and physician performance drawn from Syntellis’ analysis of data from more than 135,000 physicians and 1,000 hospitals. Key findings include:
- Hourly rates for Contract RNs rose 12.3% compared to December 2020
- Hourly rates for Respiratory Therapists were up 10.3% from 2019 to 2021
- Hospital Labor Expense per Adjusted Discharge jumped 26.8% versus December 2019
- Hospital Operating Margins fell -16.5% compared to pre-pandemic levels (without federal aid)
- Total Direct Expense per Physician rose 15.8% versus the fourth quarter of 2020
Steve Wasson
EVP and GM, Data and Intelligence Solutions
Syntellis Performance Solutions
Market Analysis
January 2022
Intense competition for nurses and other healthcare professionals continues to push healthcare costs up amid nationwide labor shortages. In 2021, many healthcare providers had to rely heavily on contract and travel nurses to bolster inadequate staffing levels. As a result, hourly rates for contract registered nurses (RNs) climbed to a high of nearly $100 per hour in November.
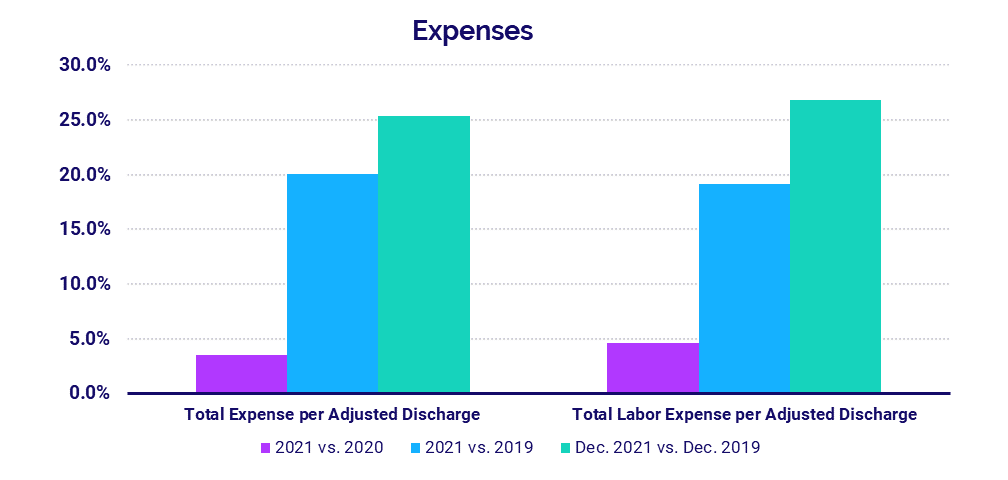
Many other healthcare professionals also saw significant pay increases in 2021. Respiratory Therapists, who remain in high demand due to the prevalence of respiratory conditions among COVID-19 patients, saw hourly rates jump 10.3% from 2019 to 2021. The higher pay rates contributed to a 19% increase in Labor Expense per Adjusted Discharge from 2019 to 2021.
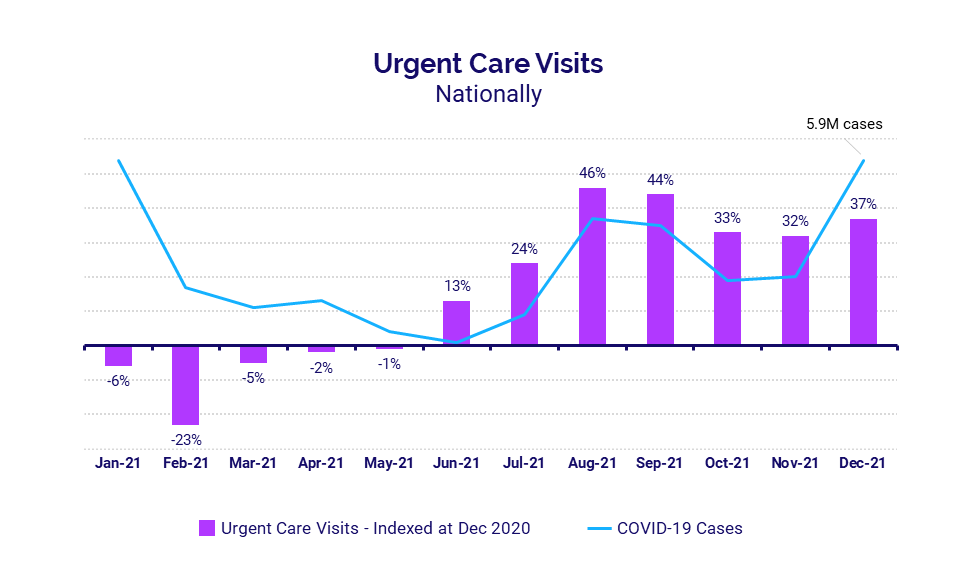
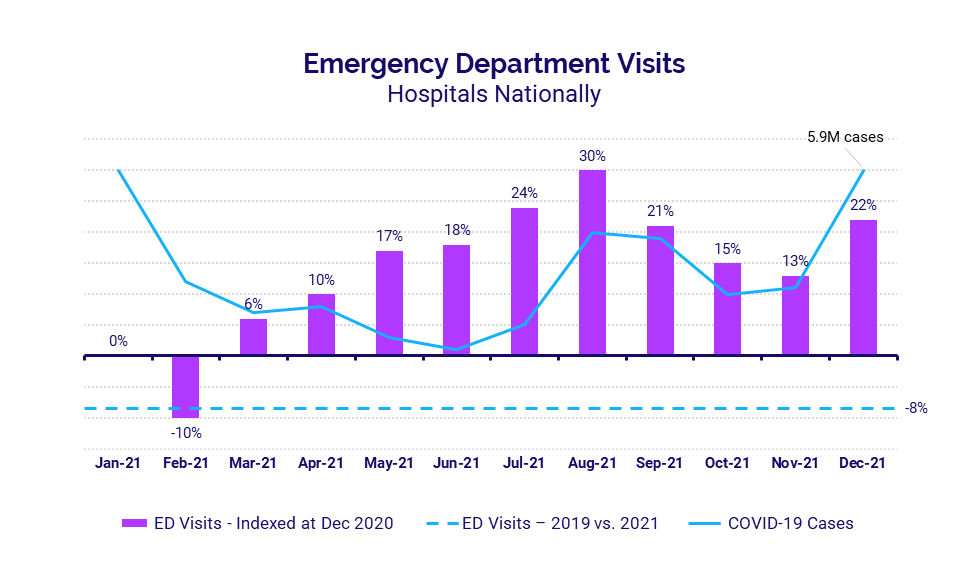
The recent surge in COVID-19 cases contributed to a spike in Urgent Care Visits during the second half of 2021 as individuals sought COVID-19 testing and alternative care sites. At the same time, emergency departments (EDs) and intensive care units (ICUs) across the country saw volumes increase due to a rise in COVID-19 patients experiencing symptoms from the virus.
Key market analysis metrics from 2021 compared to 2020 levels include:
- Contract RNs Hourly Rate +12.3% (December 2021 vs. December 2020)
- Intensive Care RNs Hourly Rate +6.7% (2021 vs. 2020 annual)
- Respiratory Therapist Hourly Rate +5.1% (2021 vs. 2020 annual)
- Urgent Care Visits +37% (December 2021 vs. December 2020)
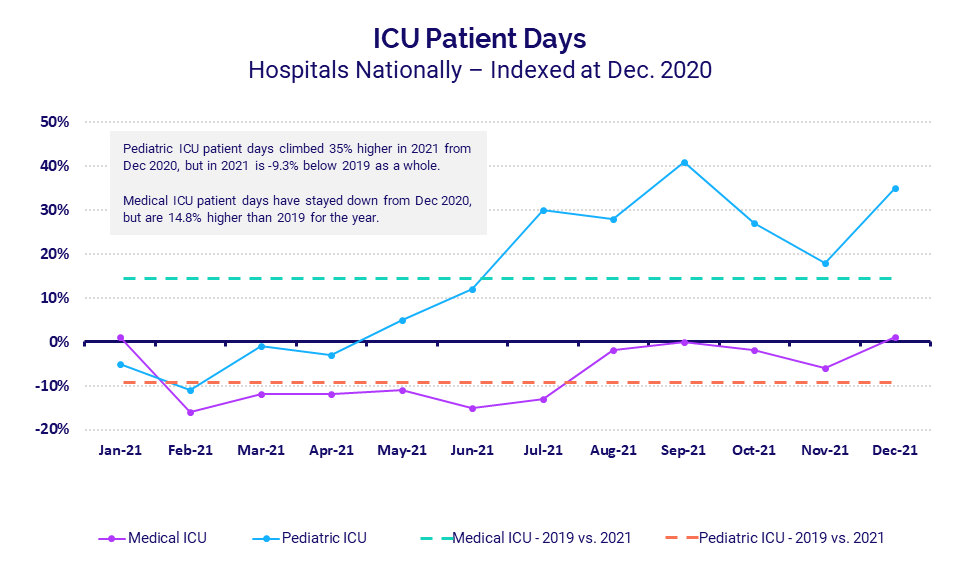
- Pediatric ICU Patient Days +35% (December 2021 vs. December 2020)
Intense competition drives up contract nursing pay
Demand for contract and travel registered nurses (RNs) was high throughout 2021, but rose dramatically during the second half of the year as hospitals and health systems vied for a narrow pool of healthcare professionals amid nationwide labor shortages. Many organizations had to pay a premium as COVID-19 surges spiked at different times across the country.
Nationwide, the median hourly rate for contract RNs reached a high of $98.89 in November before dropping to $71 at the close of the year in December — still a 12.3% year-over-year increase compared to December 2020. The median rate for employed RNs hovered between $35 and $38 per hour over the course of 2021 and was up 7.2% year-over-year in December versus December 2020.
Annual hourly rate increases surpass prior years
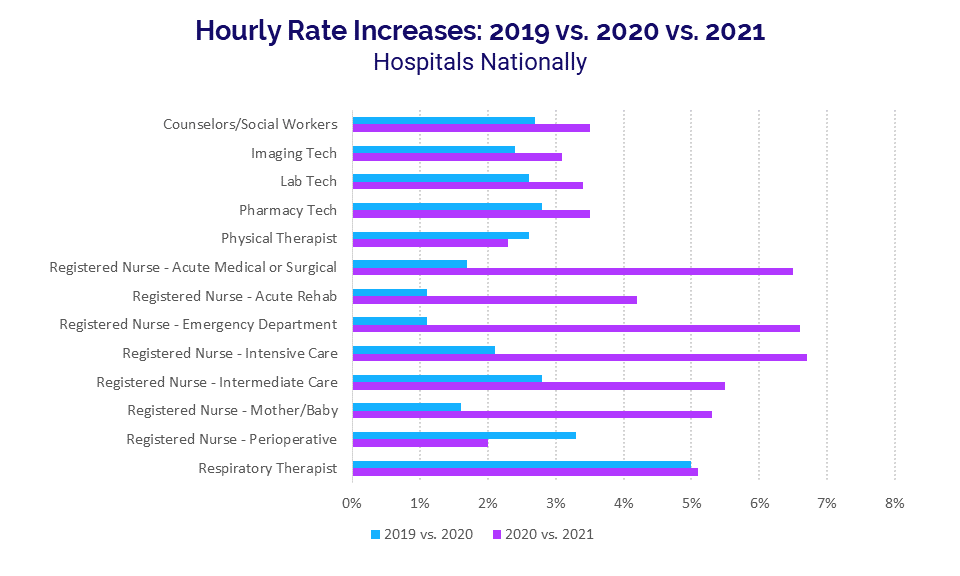
Hourly rate increases for many healthcare professionals in 2021 exceeded typical annual increases, especially in nursing. While part of the increases can be attributed to the reliance on contract or travel nurses, hourly rates for employed nurses also increased dramatically.
Intensive Care RNs had the biggest hourly rate increase of 6.7% in 2021 versus 2020, followed by Emergency Department (ED) RNs at 6.6%. Compared to before the pandemic, Intensive Care RN hourly rates were up 8.9% in 2021 versus 2019, and ED RN rates were up 7.8%.
Respiratory Therapists, who are critical in caring for patients with respiratory conditions resulting from the COVID-19 virus, saw hourly rates rise 10.3% from 2019 to 2021 and 5.1% from 2020 to 2021.
Expense per Adjusted Discharge
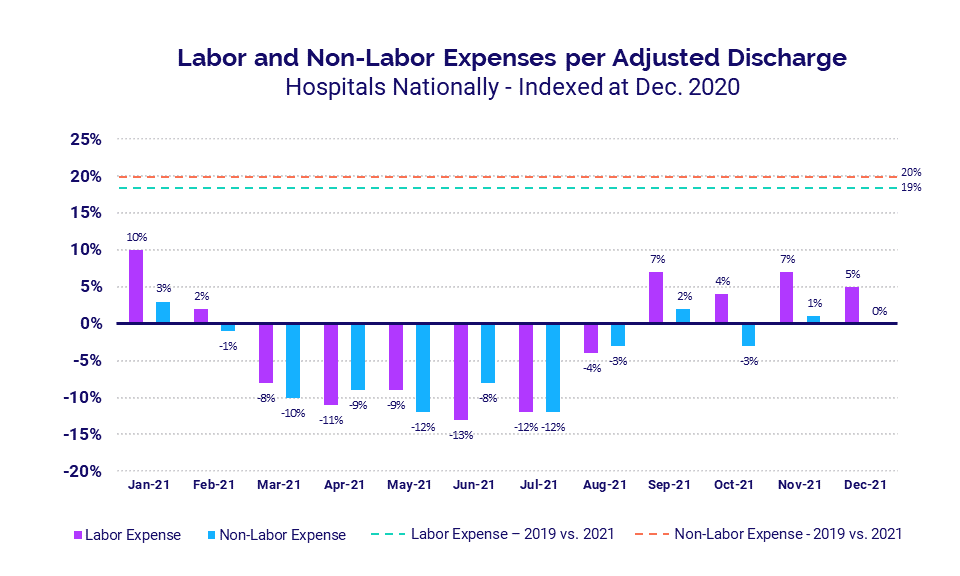
Compared to a baseline of December 2020, expenses were down for much of 2021. Labor Expense per Adjusted Discharge, however, rose above December 2020 levels during the last four months of 2021 as labor shortages intensified.
Looking at annual expenses, hospitals and health systems had significant labor and non-labor increases compared to pre-pandemic levels. Labor Expense per Adjusted Discharge was up 19% in 2021 versus 2019 while Non-labor Expense per Adjusted Discharge jumped 20%.
Urgent Care Visits rise with pandemic demands
Urgent Care Visits increased dramatically nationwide in 2021, especially during the last seven months of the year as volume trends followed a similar pattern as U.S. COVID-19 case trends. The increases came as patients sought alternative care sites and many visited urgent care centers seeking COVID-19 testing.
Compared to December 2020, the median change in Urgent Care Visits fell to a low of -23% in February before climbing to a high of up 46% in August. Urgent Care Visits were up 37% in December 2021 versus the same month in 2020.
Emergency Department Visits
ED Visits rose for 10 of 12 months in 2021 compared to December 2020 levels. Like urgent care sites, ED Visits roughly followed national trends in COVID-19 cases for the latter half of the year.
ED Visits ended December 2021 up 22% year-over-year, but overall ED Visits for all of 2021 remained -8% below 2019 levels. These volume declines compared to pre-pandemic levels have implications for other hospital departments, which typically see some patient flow from the ED.
ICUs continue to see high numbers of COVID-19 patients
Intensive Care Units (ICUs) have been a focal point during the pandemic as they have treated many seriously ill COVID-19 patients.
Median Pediatric ICU Patient Days climbed steadily throughout much of 2021 and ended the year up 35% compared to December 2020.
However, compared to 2019, Median Pediatric ICU Patient Days were down -9.3% for the year as a whole — though localized spikes in COVID-19 cases meant some ICUs saw influxes of patients at various times of the year that exceeded 2019 levels.
Median Medical ICU Patient Days fell below December 2020 levels for nine months of the year, but were up 14.8% for 2021 as a whole compared to before the pandemic in 2019.
Hospital KPIs
January 2022
Nationwide labor shortages and global supply chain issues continued to strain hospitals and health systems toward the end of 2021, contributing to increased expenses across all categories. Total Expense per Adjusted Discharge, Labor Expense per Adjusted Discharge, and Non-Labor Expense per Adjusted Discharge for the year all saw significant increases compared to both 2019 and 2020 levels.
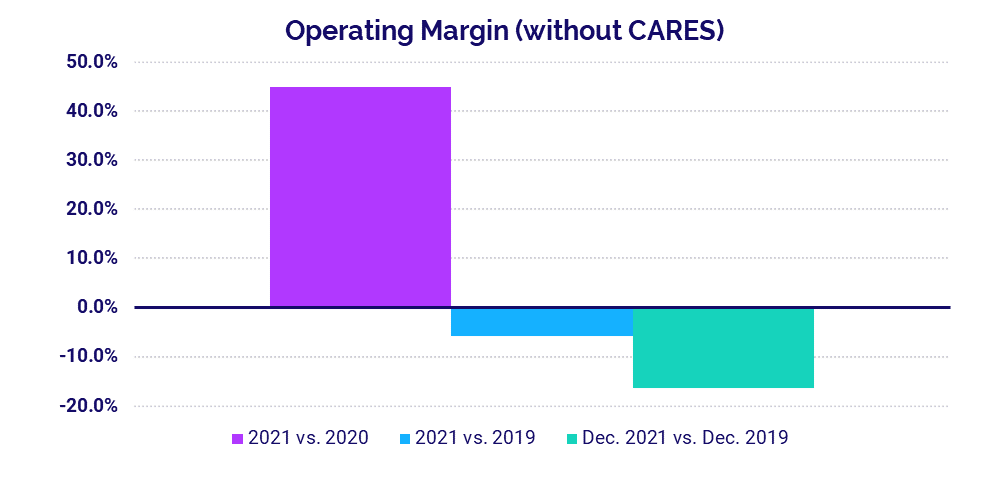
Hospital operating margins suffered as a result, with overall Operating Margin down -5.8% for the year versus before the pandemic, not including federal Coronavirus Aid, Relief, and Economic Security (CARES) Act funding. Hospital volumes also dropped below pre-pandemic performance across key metrics.
December 2021 financial KPIs for U.S. hospitals and health systems compared to December 2019 include:
- Total Expense per Adjusted Discharge +25.4%
- Labor Expense per Adjusted Discharge +26.8%
- Operating Margin (without CARES) -16.5%
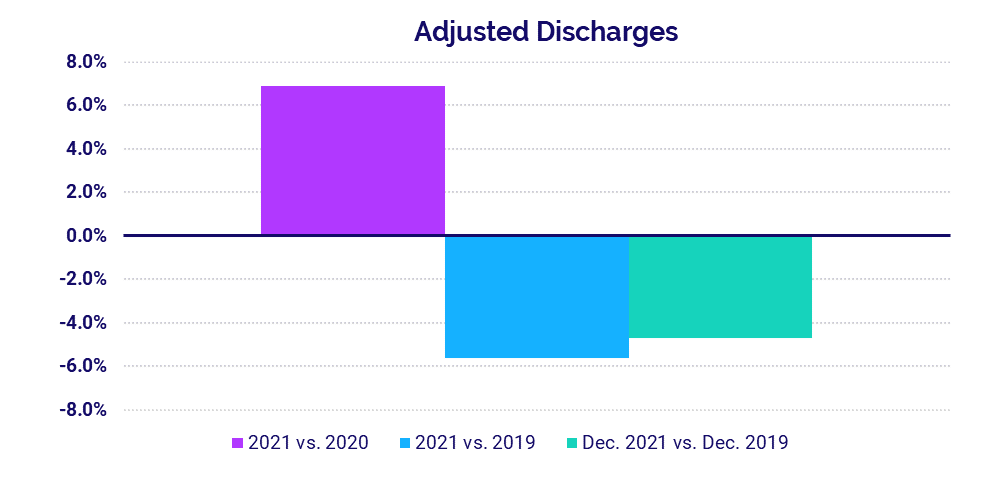
- Adjusted Discharges -4.7%
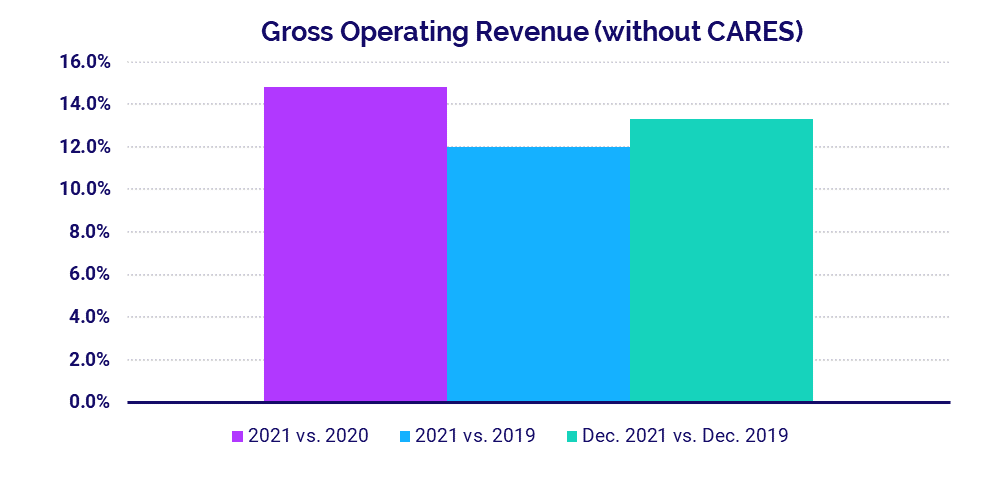
- Gross Operating Revenue +13.3%
Expenses rise with labor shortages, supply issues
Total Expense per Adjusted Discharge jumped 25.4% in December versus the same month in 2019 and was up 3% from December 2020. Nationwide labor shortages contributed to a 26.8% increase in Labor Expense per Adjusted Discharge compared to December 2019, despite a -6.4% drop in Full-Time Equivalents per Adjusted Occupied Bed over the same period. Global supply chain challenges also helped push Non-Labor Expense per Adjusted Discharge up 24.5% year-over-year versus the last month of 2019.
For all of 2021, Total Expense per Adjusted Discharge was up 20.1%, Labor Expense per Adjusted Discharge was up 19.1%, and Non-Labor Expense was up 19.9% compared to 2019 levels. Hospitals in the Midwest had the greatest year-over-year increases in both Total Expense per Adjusted Discharge (up 10.9%) and Labor Expense per Adjusted Discharge (up 13.3%).
Margins down from pre-pandemic levels
The median hospital Operating Margin was down -16.5% year-over-year in December compared to the same month in 2019, not including CARES Act funding. For the year overall, Operating Margin without CARES was up 44.8% compared to 2020 but down -5.8% versus 2019. With the federal aid, Operating Margin was up 18.5% for the year compared to 2020 and up 8.9% versus 2019.
Operating Earnings Before Interest, Taxes, Depreciation, and Amortization (EBITDA) Margin increased 27.4% from 2020 to 2021 and decreased -6.5% from 2019 to 2021 without CARES. With CARES, Operating EBITDA Margin rose 8.9% from 2020 to 2021 and 2% from 2019 to 2021.
Hospital volumes remain below 2019 performance
Adjusted Discharges, Emergency Department (ED) Visits, and Operating Room Minutes all fell below 2019 levels, both compared to December 2019 and for 2019 versus 2021 overall. Adjusted Discharges were down -4.7% for the month versus December 2019, but up 6.4% versus December 2020. Patient Days increased across the board, rising 5.3% compared to December 2019 and 2.8% versus December 2020, due in part to high numbers of COVID-19 patients requiring inpatient care.
Adjusted Discharges were up year-over-year across all regions in December. Hospitals in the Northeast/Mid-Atlantic had the biggest increase at 10.4%, while hospitals in the West had the least increase of 0.6% year-over-year. Patient Days increased year-over-year for hospitals in four of five regions, but dropped -30.4% in the Great Plains.
Revenues surpass 2019 and 2020 levels
Gross Operating Revenue (without CARES) increased 13.3% from December 2019 to December 2021 and 9.8% from December 2020 to December 2021. Inpatient Revenue was up 14.3% from December 2019 to December 2021 and 4.1% from December 2020 to December 2021. Outpatient Revenue rose 13.2% from December 2019 to December 2020 and 14.3% from December 2020 to December 2021.
For the year overall, Gross Operating Revenue rose 12% versus 2019 and 14.8% versus 2020, Inpatient Revenue increased 10% versus 2019 and 11.5% from 2020, and Outpatient Revenue was up 11.1% versus 2019 and 18.6% compared to 2020.
Looking at revenues by region, Net Patient Service Revenue (NPSR) per Adjusted Discharge increased year-over-year for all regions except the Northeast/Mid-Atlantic, which was down -3.1%. Hospitals in the South had the biggest year-over-year increase at 7%.
Physician Practice KPIs
January 2022
Physician practices across the country were hit with rising expenses in 2021, as they dealt with many of the same challenges affecting the nation’s hospitals. Per-physician expenses continued to climb even as physician productivity increased and support staff levels fell by double digits compared to late 2020. Hospitals and other organizations that own physician practices had to invest more dollars to support those practices as a result, putting further stress on healthcare providers heading into 2022.
The top five physician financial and operational KPIs from the fourth quarter of 2021 versus the same quarter in 2020 are:
- Total Direct Expense: +15.8%
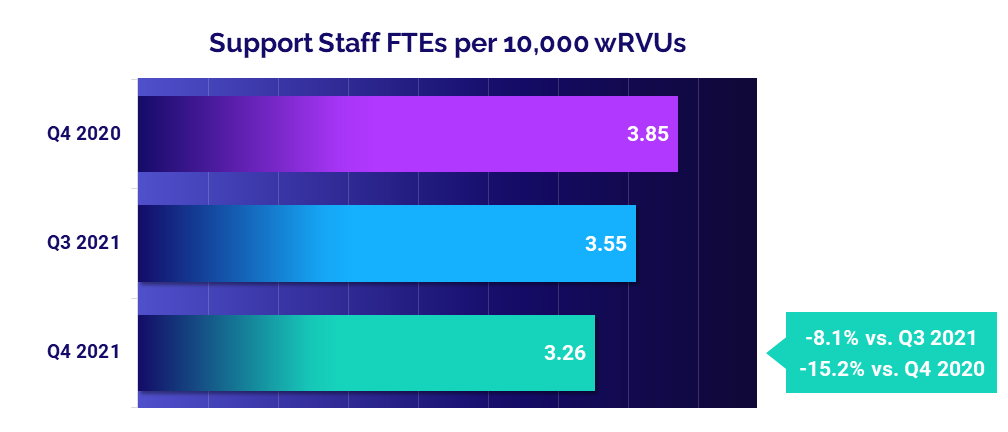
- Support Staff Levels: -15.2%
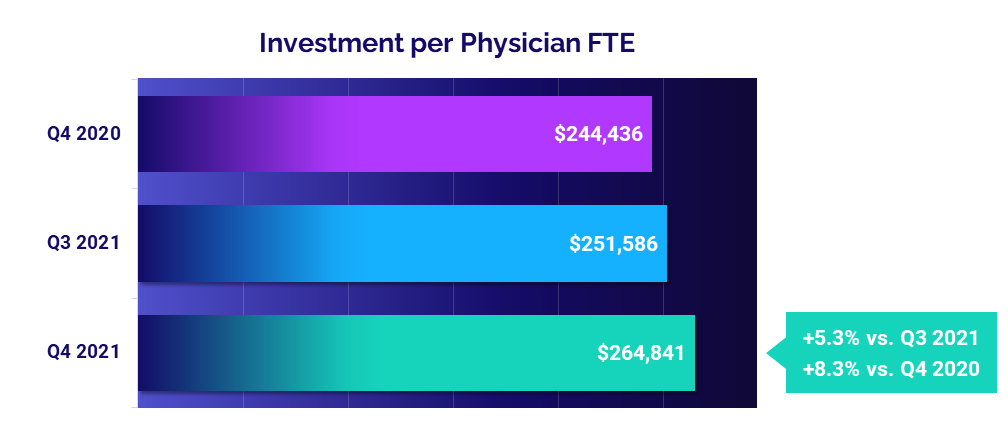
- Investment: +8.3%
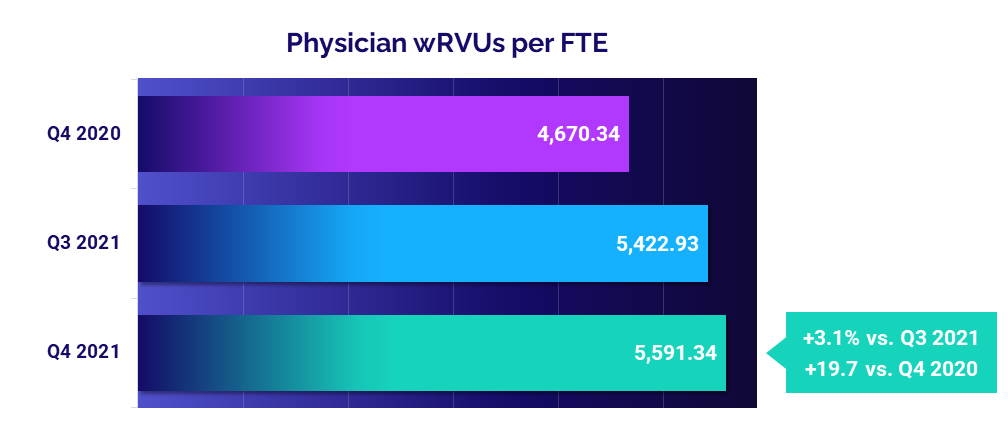
- Productivity: +19.7%
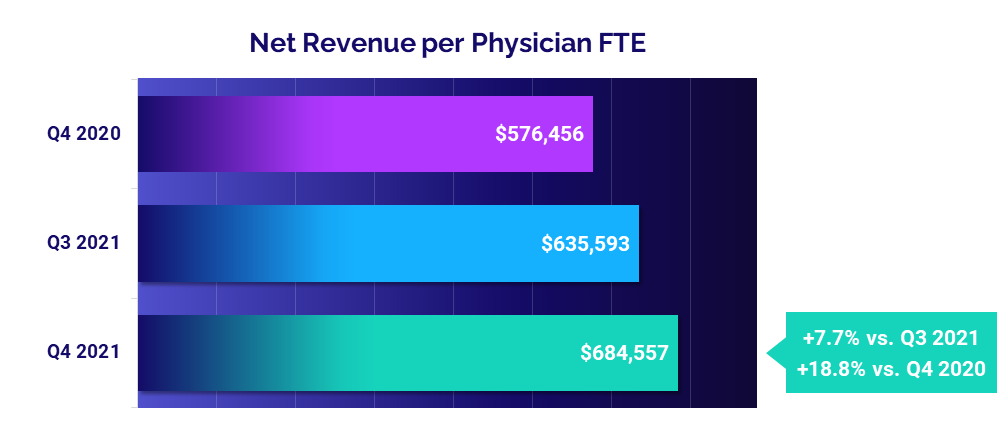
- Revenue: +18.8%
Physician expenses exceed 2020 levels
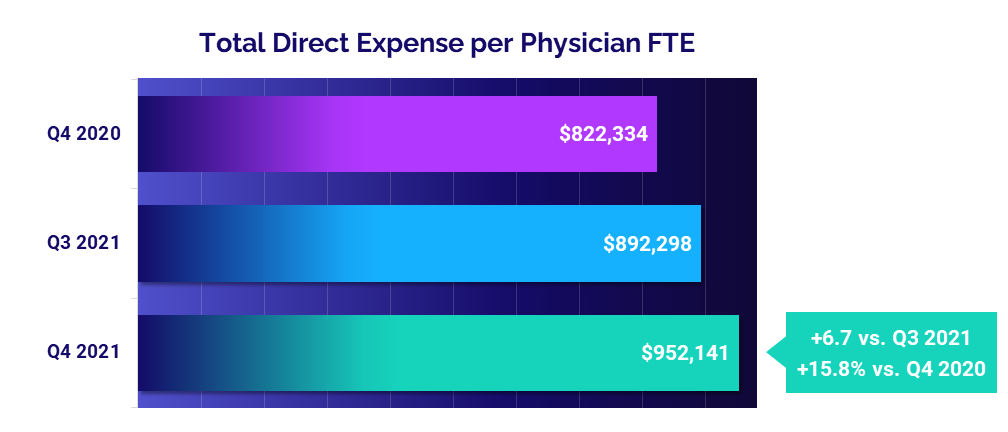
The median Total Direct Expense per Physician Full-Time Equivalent (FTE) — including advanced practice providers or APPs — climbed to $952,141 in the fourth quarter of 2021. That was up 6.7% from $892,298 in the third quarter and up 15.8% from $822,334 in the fourth quarter of 2020.
Physician practices in the Midwest had the biggest quarter-to-quarter increase in Total Direct Expense per Physician FTE at 10.6% to $856,568. The West had the highest median expense for the quarter compared to other regions at $1.13 million per physician — up 8.3% from the third quarter. Looking at expenses by specialty, Primary Care had the biggest quarter-to-quarter increase at 11.8% from the third quarter to $971,003 in the fourth quarter.
Support staff levels drop
Staffing levels, as measured by Support Staff FTEs per 10,000 work Relative Value Units (wRVUs), declined -8.1% from the third to the fourth quarters of 2021. Over the course of the year, staffing levels decreased for three of four quarters, with only a slight increase occurring from the second to the third quarters. Year-over-year, Support Staff FTEs per 10,000 wRVUs were down -15.2% from the fourth quarter of 2020 to the fourth quarter of 2021.
Primary Care had the biggest drop in staffing levels. Support Staff FTEs per 10,000 wRVUs for the specialty area fell -9.8% from the third to fourth quarters and -13.3% from the fourth quarter of 2020 to the same quarter of 2021.
Investments increase as expenses climb
The level of investment needed to support physician practices worsened in 2021, due in part to rising expenses. The median Investment per Physician FTE increased 5.3% from the third quarter to $264,841 in the fourth quarter. Compared to $244,436 in the fourth quarter of 2020, median Investment per Physician FTE was up 8.3%.
Physician practices in the Midwest had the biggest quarter-to-quarter increase at 54.4%, while practices in the West had the only quarter-to-quarter decrease at -13.7%. Physician practices in the South had the highest Investment per Physician FTE for the quarter at $363,835. Among different specialty groups, Obstetrics and Gynecology (OB/GYN) had the biggest quarter-to-quarter increase in Investment per Physician FTE at 29.3%.
Physician productivity rises
Physician productivity rose in the fourth quarter of 2021, with Physician wRVUs per FTE up 3.1% from the third quarter and jumping 19.7% from the fourth quarter of 2020. The increase demonstrates how physician practices adjusted productivity relative to pandemic-era volumes during the second year of COVID-19.
OB/GYN had the biggest quarter-to-quarter increase in Physician wRVUs per FTE, up 10.4% from the third to the fourth quarters. Year-over-year, Primary Care had the biggest increase from the fourth quarters of 2020 and 2021 at 26.3%, followed by Medical Specialties at 26.1%.
Physician revenues up from 2020
Physician revenues rose again in the fourth quarter of 2021 following a slight decline the previous quarter. The median Net Revenue per Physician FTE (including APPs) was $684,557 for the quarter, up 7.7% from the third quarter and up 18.8% from the fourth quarter of 2020.
Physician practices in the West had the biggest increases, with Net Revenue per Physician FTE up 15.8% from the third quarter and up 20.5% from the fourth quarter of 2020. Primary Care had the biggest increases compared to other specialty cohorts, with Net Revenue per Physician FTE rising 11.8% from the third quarter and 25.1% from the fourth quarter of 2020.
The Road Ahead for Healthcare
Healthcare providers across the country felt the pains of nationwide labor shortages, global supply chain challenges, and continued COVID-19 surges throughout 2021. The repercussions included escalated expenses, unstable volumes, narrowed operating margins, and higher overall care costs. Unfortunately, those same pressures are continuing in 2022, with some expected to worsen in the coming months and no sure signs of an end to any of them.
Our latest market analysis and key performance indicators illustrate the multi-pronged impacts of these and other forces on the healthcare industry. While many providers stabilized somewhat compared to the uncertainties of 2020, overall performance remains well below pre-pandemic 2019 levels. Building and maintaining long-term financial stability requires healthcare leaders to be flexible, agile, and prepared for a variety of possible "new normals."
If 2020 and 2021 have taught us anything, it is the importance of reliable data to monitor and navigate industry volatility. For an in-depth understanding of the ongoing changes to healthcare’s financial landscape, leaders need the ability to track KPIs in real time, identify opportunities for improvement, and effectively guide recovery efforts with informed planning decisions.
Source: Syntellis’ Axiom™ Comparative Analytics, which offers access to real-time data drawn from more than 135,000 physicians from over 10,000 practices and 139 specialty categories, and from 500+ unique departments across more than 1,000 hospitals. Powered by Syntellis IQ, Comparative Analytics also provides data and comparisons specific to a single organization for visibility into how their market is evolving.
Regional data is broken down by state. The Northeast/Mid-Atlantic includes ME, VT, NH, MA, RI, CT, NY, PA, NJ, DE, MD, WV, and VA. The South includes FL, TX, LA, MS, AL, GA, SC, NC, OK, AR, TN, and KY. The Midwest includes WI, MI, IL, IN, and OH. The Great Plains includes ND, SD, NE, KS, MN, IA, and MO. The West includes CA, AZ, NM, NV, UT, CO, OR, ID, WY, WA, MT, AK, and HI.

