Executive Summary
Healthcare Providers Endure Sustained Margin Pressures
The nation’s healthcare providers continue to face significant headwinds as the impacts of high expenses rippled across the industry eight months into 2022. Key trends seen in August include:
- Operating margins have remained down throughout 2022 as hospitals battle high expenses.
- Labor expense increases continue to outpace non-labor expense increases due largely to challenges associated with widespread labor shortages.
- Elevated contract labor costs show signs of easing with increases in hourly pay lessening in recent months.
- Outpatient revenues rose significantly as more patients sought outpatient care.
- High per-physician expenses pushed up investments needed to support physician practices.
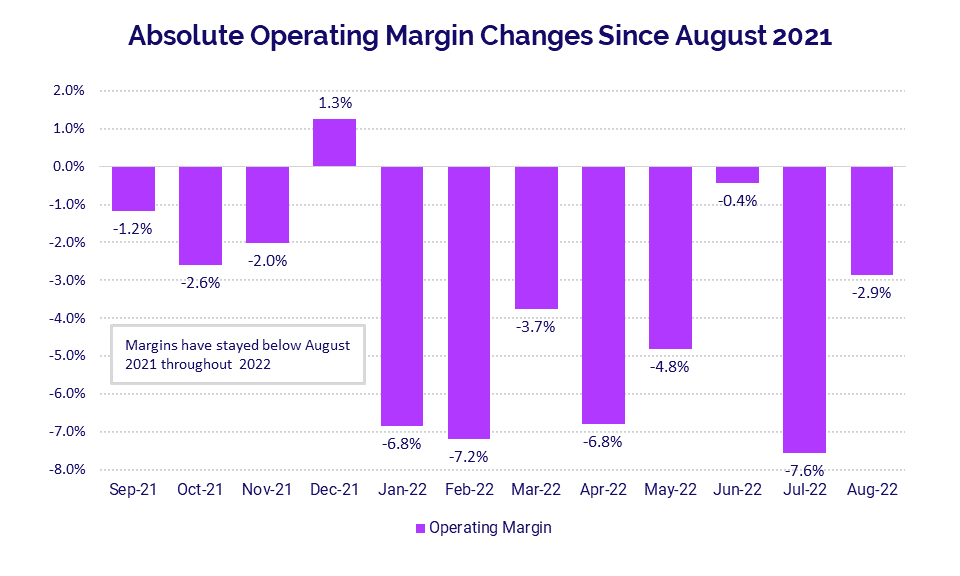
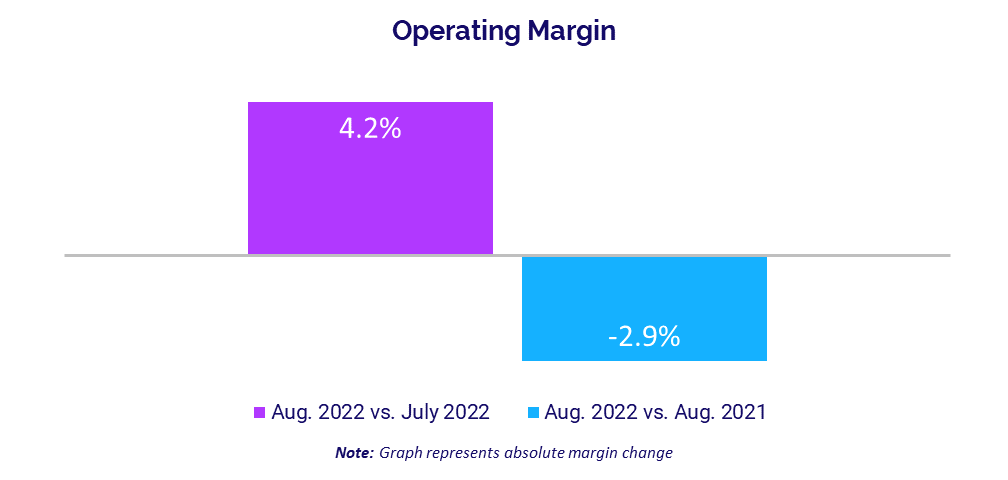
U.S. hospitals experienced an eighth consecutive month of year-over-year (YOY) margin declines in August, as ongoing expense pressures continue to destabilize their long-term financial health. The absolute change in Operating Margin dropped -2.9 percentage points compared to August 2021. The decline came after a significant -7.6 percentage point drop in July. Operating Margins have consistently fallen below August 2021 levels since the start of 2022.
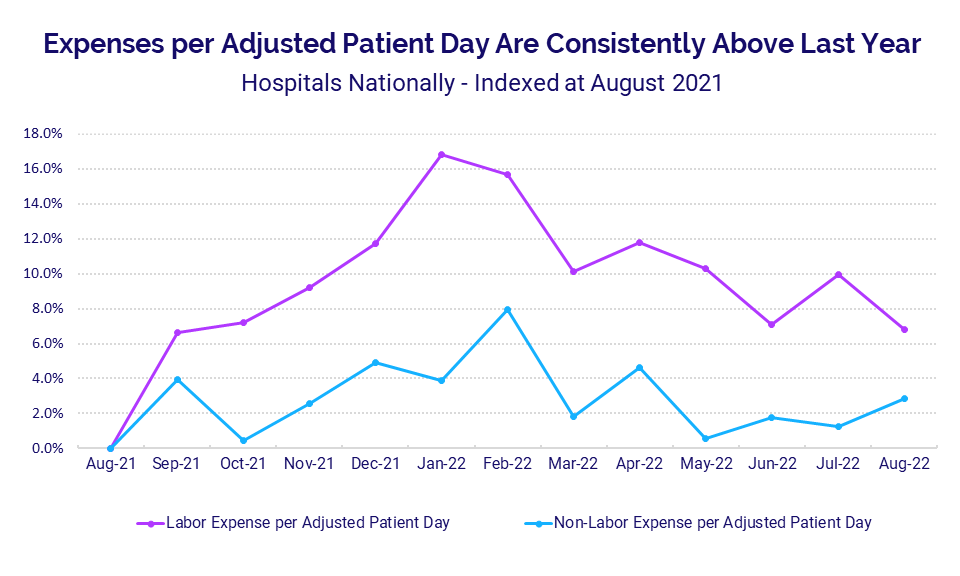
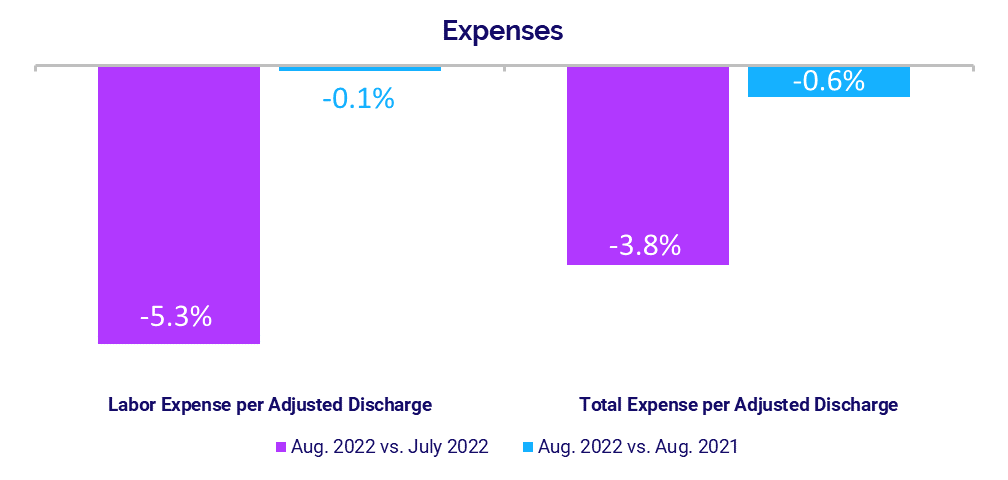
High expenses continue to be the primary culprit for poor margin performance, with growth in labor expenses exceeding non-labor expense increases for the past 12 months. Labor Expense per Adjusted Patient Day peaked at 16.8% above August 2021 levels during the Omicron surge in January. The rate of increases lessened in the ensuing months, but the metric remained up 6.8% in August 2022 compared to the same baseline. However, some expense metrics showed minimal improvements in August after months of increases. Total Expense per Adjusted Discharge was down -0.6% YOY and Labor Expense per Adjusted Discharge decreased -0.1%.
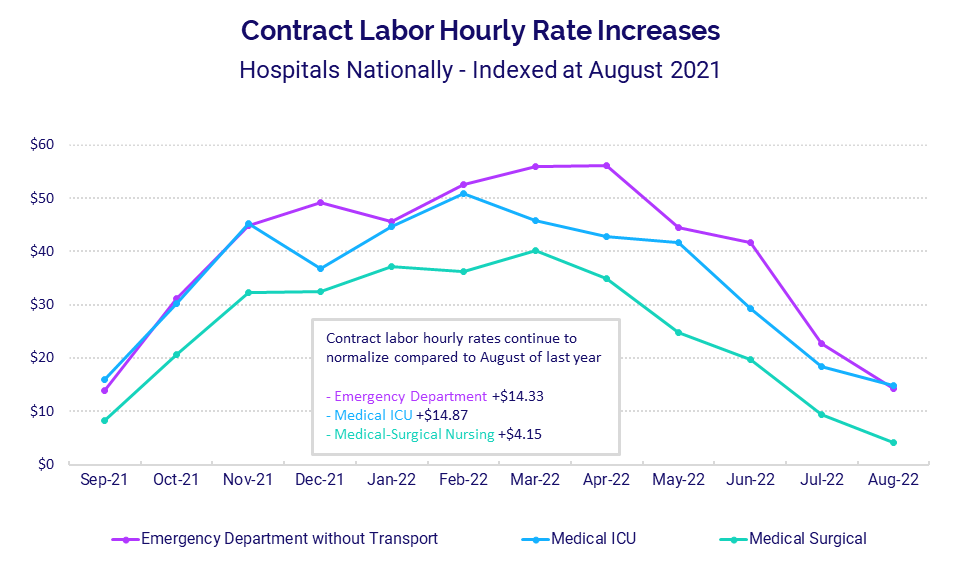
Contract labor costs skyrocketed earlier in the year as many providers turned to agencies to help fill labor shortages, but those costs have steadily declined over the past four months. The median Contract Hourly Rate for Emergency Department personnel, for example, decreased more than $41 per hour from April to August 2022.
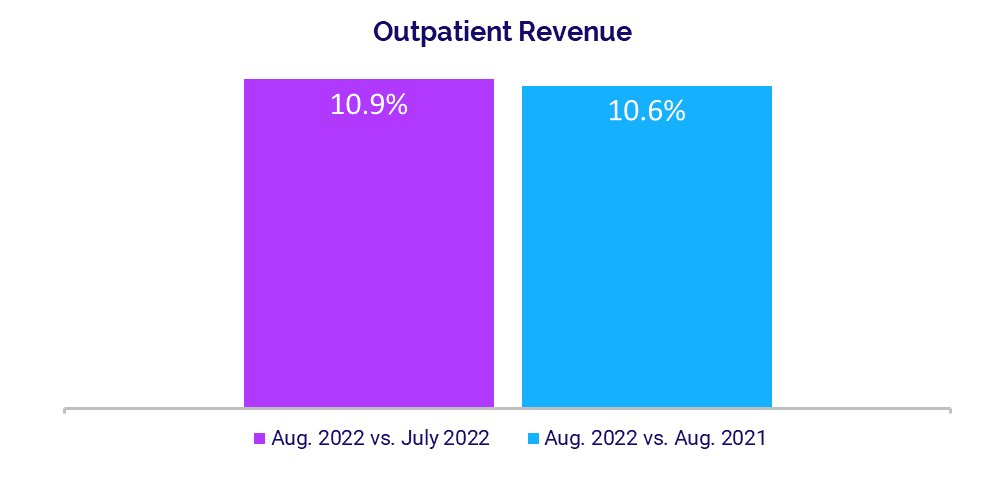
Hospitals saw a sizable increase in Outpatient Revenue in August, with the metric jumping 10.6% YOY as more patients sought outpatient care in the final months of summer. The gains pushed Gross Operating Revenue up 5.5% YOY for the month despite Inpatient Revenue declines.
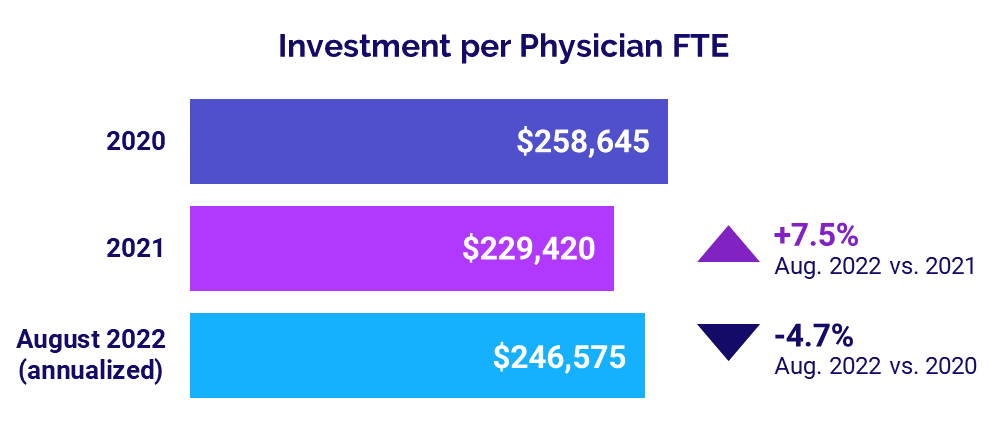
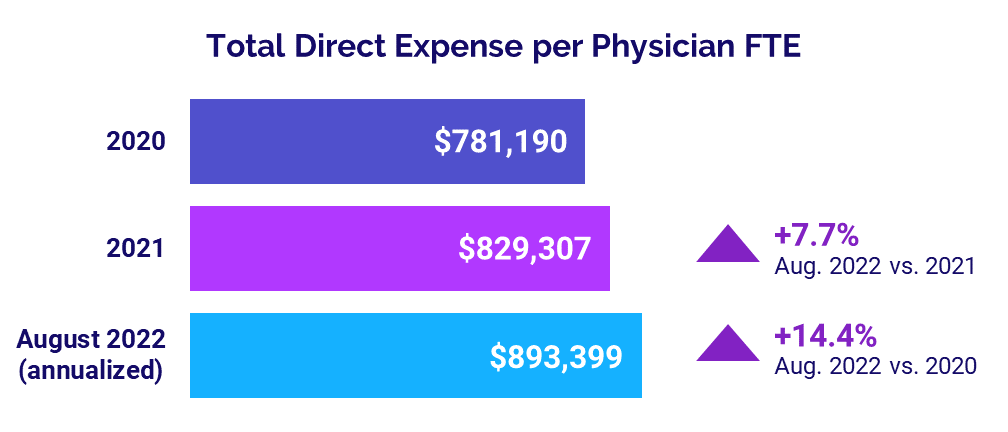
Physician practices continue to see rising expenses push up investments. The annualized median investment needed to support physician practices rose 7.5% YOY to $246,575 per physician in August while Total Direct Expense per Physician rose 7.7% to $893,399 over the same period.
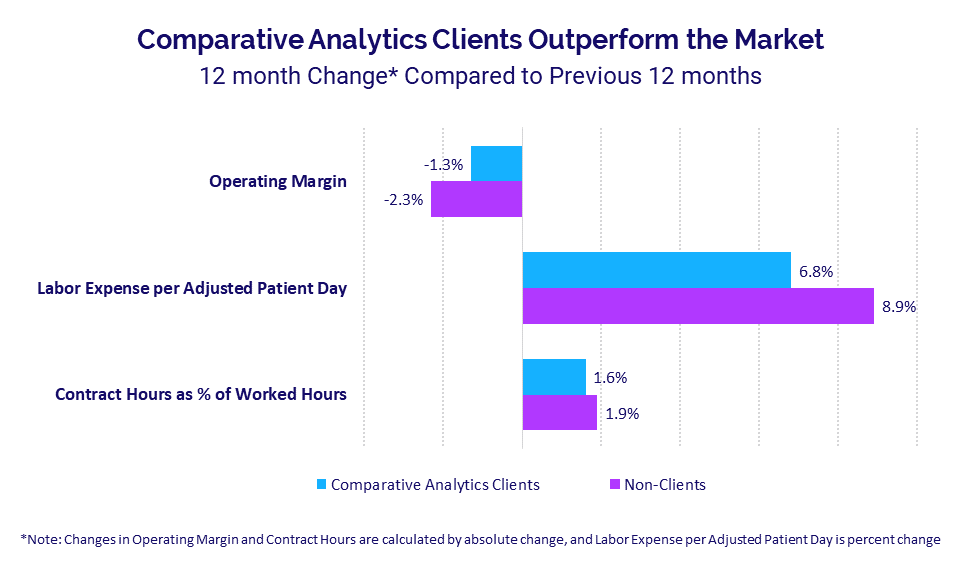
But there is good news: Robust data and analytics capabilities are helping healthcare providers navigate current industry challenges and outperform the broader market. An analysis of more than 180 hospitals that use Axiom™ Comparative Analytics shows they are better controlling margin declines and labor cost increases. Over the past 12 months, Operating Margins declined by -1.3 percentage point at organizations using the solution compared to a -2.3 percentage point change for non-users. This shows that when healthcare leaders have deeper insights into expense challenges, they can take action that effectively limits expense growth while remaining focused on quality.
Steve Wasson
EVP and GM, Data and Intelligence Solutions
Syntellis Performance Solutions
Market Analysis
September 2022
Key August market analysis metrics include:
- Operating Margin -2.9 percentage points
- Labor Expense per Adjusted Patient Day +6.8%
- Medical ICU Contract Hourly Rate +$14.87
- 12-month Labor Expense per Adjusted Patient Day (Syntellis’ Axiom™ Comparative Analytics users) +6.8%
- 12-month Labor Expense per Adjusted Patient Day (non-Axiom Comparative Analytics users) +8.9%
Operating Margins See Significant Declines
Extreme expense pressures and lagging volumes have helped push hospital operating margins down throughout 2022 to date. Compared to a baseline of August 2021, the median Operating Margin plummeted during the Omicron surge down -6.8 percentage points in January and -7.2 percentage points in February. Operating Margins fluctuated throughout the Spring and Summer, dropping to a low of -7.6 percentage points in July and again falling -2.9 percentage points in August compared to August 2021.
Hospital expenses have been high for the past 12 months, but growth in labor expenses continues to far outpace growth in non-labor expenses. Compared to a baseline of August 2021, growth in Labor Expense per Adjusted Patient Day was up 6.8% in August while Non-Labor Expense per Adjusted Patient Day was up 2.8%.
Labor Expense per Adjusted Patient Day peaked during the Omicron surge in January 2022, jumping 16.8% above the August 2021 baseline. Non-Labor Expense per Adjusted Patient Day reached its peak the following month, rising 7.9% above the same baseline in February of this year.
Contract Labor Cost Increases Easing
High contract labor costs during a nationwide labor shortage have contributed to elevated labor costs, with significant increases occurring across key hospital departments over the past 12 months but softening somewhat since April. Hourly rates paid to staffing firms for Emergency Department (ED) contract labor peaked at $56.17 above August 2021 rates in April 2022 and were up $14.33 above the baseline in August.
Hourly rates paid to firms for Medical Intensive Care Unit (ICU) contract labor were highest in February of this year at $50.87 above August 2021 levels, but were down to $14.87 above the baseline in August. Contract labor hourly pay also increased for Medical Surgical Nursing departments. The metric reached a height of $40.23 above the August 2021 baseline in March 2022 and was $4.15 above the baseline in August 2022.
Labor, Medical Supply Expenses Up in Key Areas
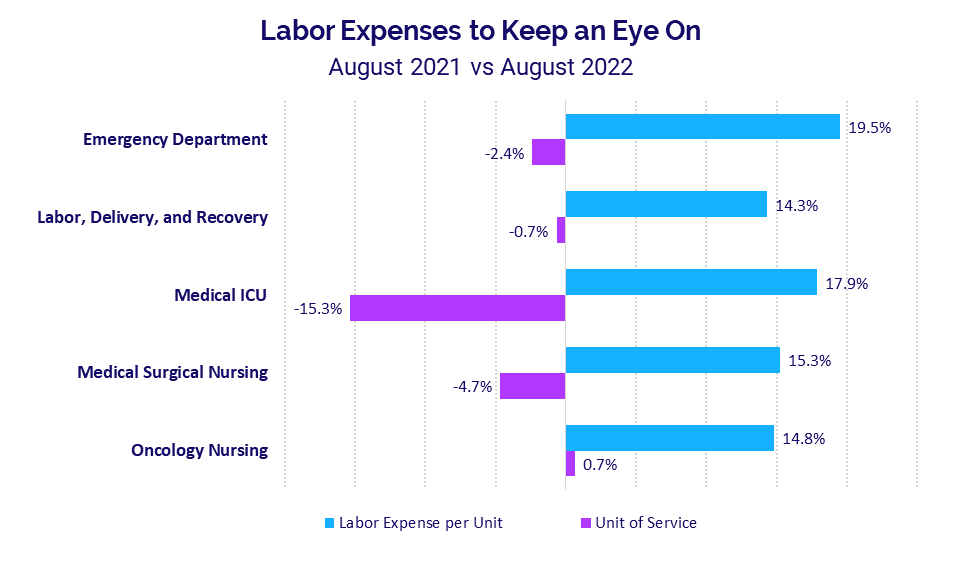
YOY changes in labor expense per unit of service were high in August across several core hospital departments despite volume decreases across most.
EDs had the biggest increases, with Labor Expense per Visit jumping 19.5% YOY despite a –2.4% YOY decrease in ED Visits for the month. Medical ICUs had the second largest expense increase, with Labor Expense per Patient Day up 17.9% YOY. At the same time, Medical ICUs had the biggest decrease in volumes for the month, with Medical ICU Patient Days down -15.3% YOY.
Oncology Nursing had a 14.8% YOY increase in Labor Expense per Patient Day and was the only department to see a slight volume increase for the month at 0.7% YOY.
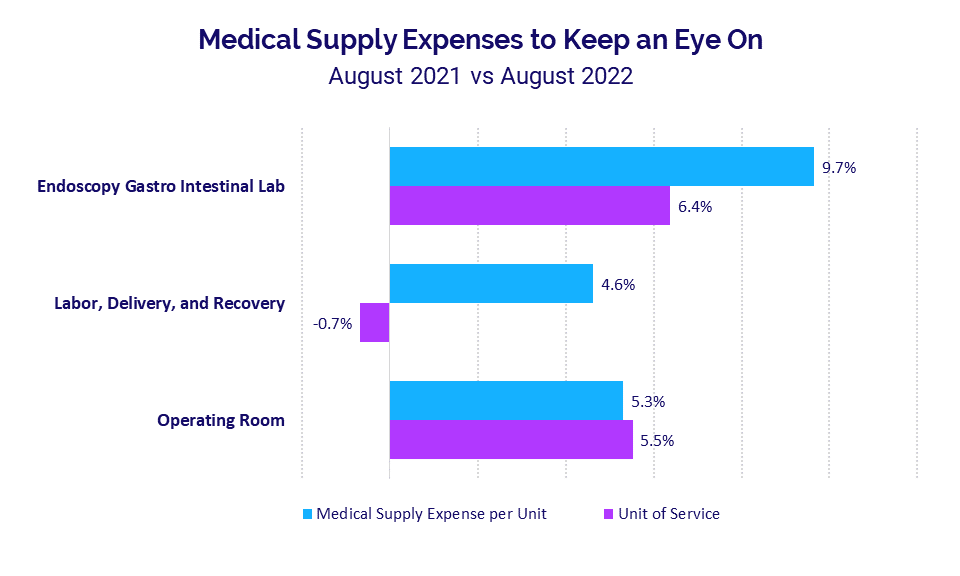
Medical Supply Expense also climbed in August across many departments. Endoscopy Gastro Intestinal Labs had the biggest jump, with Medical Supply Expense per Procedure up 9.7% YOY while Procedures rose 6.4% YOY for the month. Operating Rooms (ORs) had the second highest increase, with Medical Supply Expense per OR Minute up 5.3% YOY and OR Minutes up 5.5% YOY.
Data & Analytics Capabilities Help Drive Better Results
A deeper look at trends in key performance indicators compared hospitals that use robust data and analytics to monitor financial performance and drive improvements versus those that do not. The analysis suggests that hospitals that use such tools fare better when it comes to controlling operating margin declines, labor expense increases, and contract labor costs.
For example, hospitals that use Syntellis’ AxiomTM Comparative Analytics saw median Operating Margin drop by -1.3 percentage point over the past 12 months compared to the prior 12 months. That is one percentage point better than other hospitals, which had a -2.3 percentage point decline in Operating Margin over the same period.
Looking at labor expenses, organizations using Axiom Comparative Analytics had a 6.8% increase in Labor Expense per Adjusted Patient Day compared to an 8.9% increase for hospitals that do not. Contract Hours as a Percent of Worked Hours increased 1.6 percentage points for Comparative Analytics users versus a 1.9 percentage point increase for non-users.
Hospital KPIs
September 2022
The top five financial KPIs for U.S. hospitals and health systems for August 2022 versus the same month last year are:
- Operating Margin: -2.9 percentage points
- Labor Expense per Adjusted Discharge: -0.1%
- Total Expense per Adjusted Discharge: -0.6%
- Adjusted Discharges: +5.4%
- Outpatient Revenue: +10.6%
Hospital Margins Down for an Eighth Month
Hospital operating margins were down YOY for an eighth consecutive month in August. The median absolute Operating Margin decreased -2.9 percentage points YOY. Month-over-month, however, the metric was up 4.2 percentage points from the two-year lows seen in July.
The median absolute change in Operating Earnings Before Interest, Taxes, Depreciation, and Amortization (EBITDA) Margin was down -2 percentage points YOY and up 3.7 percentage points month-over-month. Operating EBITDA Margin decreased for hospitals across all regions in August, with declines ranging from -3.5 percentage points for hospitals in the South and West to -0.4 percentage point for those in the Great Plains.
Expenses Show Some Improvements
Adjusted hospital expenses showed initial signs of improvement in August with slight YOY decreases following months of increases. Labor Expense per Adjusted Discharge was down -0.1% compared to August 2021, and down -5.3% from July.
Total Expense per Adjusted Discharge decreased -0.6% YOY and declined -3.8% month-over-month. Non-Labor Expense per Adjusted Discharge decreased -2.1% YOY and -2.5% versus July.
Expense performance varied for hospitals in different regions. Total Expense per Adjusted Discharge rose YOY for hospitals in three of five regions. Hospitals in the Northeast/Mid-Atlantic had the biggest increase at 6% YOY while those in the South had the biggest decrease at -8.7% YOY.
Volumes See Mixed Results
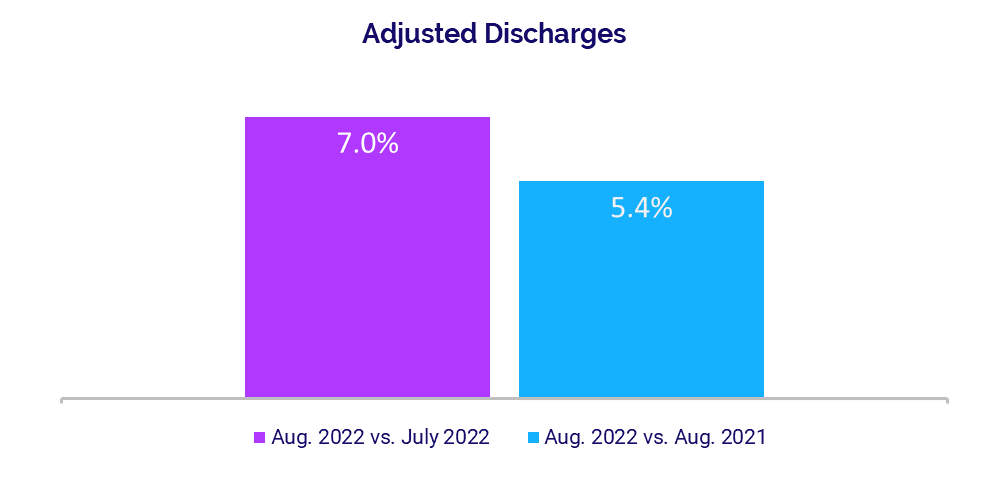
Patient volumes were mixed in August with some declines but increases across many metrics. Adjusted Discharges rose 5.4% versus the same month last year and jumped 7% from July. Adjusted Patient Days rose 1.2% YOY and 3.9% month-over-month.
Operating Room Minutes rose 5.5% YOY while both Emergency Department (ED) Visits and Average Length of Stay decreased -2.4% YOY and -2.7% YOY, respectively.
Volume performance varied for hospitals across the country. Adjusted Discharges rose YOY for hospitals in all regions, with increases ranging from 1.2% in the Midwest to 13.4% in the South. Adjusted Patient Days were up YOY for four of five regions, with the South seeing the only decrease at -1.3% YOY.
Outpatient Revenues Increase
Hospitals saw some revenue gains in August as patients sought more outpatient care. Gross Operating Revenue rose 5.5% YOY, driven by a sizable 10.6% YOY increase in Outpatient (OP) Revenue. At the same time, Inpatient Revenue decreased -3.5% YOY. Month-over-month, Gross Operating Revenue rose 9.1%, OP Revenue jumped 10.9%, and IP Revenue rose 4.9%.
Net Patient Service Revenue (NPSR) per Adjusted Discharge was down -5.8% YOY for hospitals nationwide and decreased for hospitals across four of five regions. Declines in NPSR per Adjusted Discharge ranged from -1.5% YOY in the Northeast/Mid-Atlantic to -17.1% YOY in the South. The Great Plains was the only region to see a slight increase in the metric at 0.5% YOY.
Physician Practice KPIs
September 2022
The top five physician financial and operational KPIs for August 2022 annualized versus 2021 were:
- Investment: +7.5%
- Total Direct Expense: +7.7%
- Productivity: +4.3%
- Revenue: +3.8%
- Support Staff Levels: -2.2%
Physician Investments Remain High
Investments needed to support physician practices again rose above 2021 levels in August but fell below the first year of the pandemic in 2020. The annualized median Investment per Physician Full-Time Equivalent (FTE) was $246,575 in August, up 7.5% versus 2021 and down -4.7% from $258,645 in 2020.
Across different regions, the annualized median Investment per Physician FTE was above 2021 levels for four of five regions. Physician practices in the West had the biggest increase at 37.9%, while those in the Great Plains had the only decrease at -22.2%.
Median Investment per Physician FTE rose above both 2021 and 2020 levels for four of five specialty cohorts. Obstetrics and Gynecology (Ob/Gyn) had the biggest increases at 37.8% and 20.6%, respectively. Primary Care was the only specialty to see a decrease with the metric down -22.4% versus 2020.
Physician Expenses Above 2021 and 2020 Levels
Expenses continued to rise for physician practices nationwide. The annualized median Total Direct Expense per Physician FTE (including advanced practice providers) was $893,399 for August. That was up 7.7% versus 2021 and up 14.4% compared to $781,190 in 2020.
Expenses surpassed 2021 and 2020 levels for physician practices in all regions in August. Practices in the West had the biggest increases, with median Total Direct Expense per Physician FTE up 12.4% from 2021 and up 19.6% from 2020.
The August annualized Total Direct Expense per Physician FTE also rose versus both 2021 and 2020 levels for physician practices across all specialties. Surgical Specialties had the biggest increase from 2021 at 9% while Primary Care had the biggest increase from 2020 at 16.9%.
Physician Productivity Outpaces Prior Years
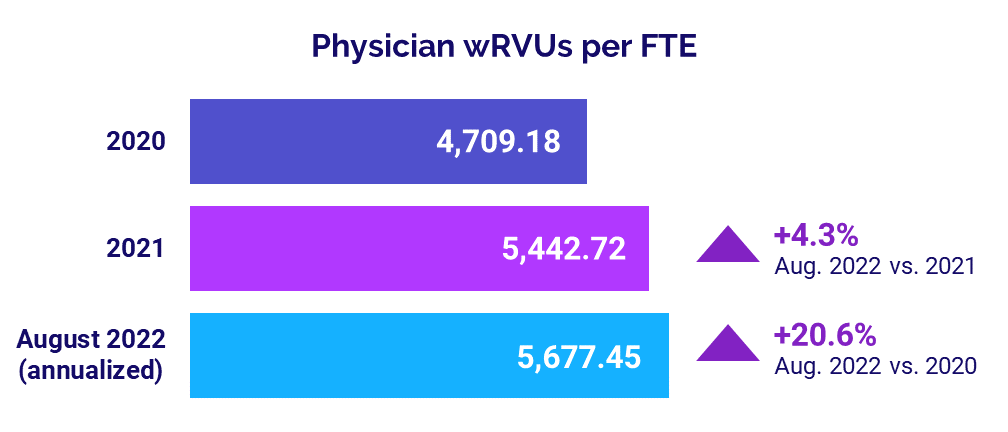
Physician productivity continued to increase in August, again rising above 2021 and 2020 levels. Annualized median Physician work Relative Value Units (wRVUs) per FTE were 5,677.45 for the month, up 4.3% from 2021 and up 20.6% from 4,709.18 in 2020.
Median Physician wRVUs per FTE rose across four of five specialties in August (annualized) compared to both 2021 and 2020. Ob/Gyn had the biggest increases, with the metric up 16% compared to 2021 and up 29.8% from 2020. Hospital-based Specialties was the only cohort to see a decline in the metric, which was down just -0.8% from 2021.
Physician Revenues Remain Up
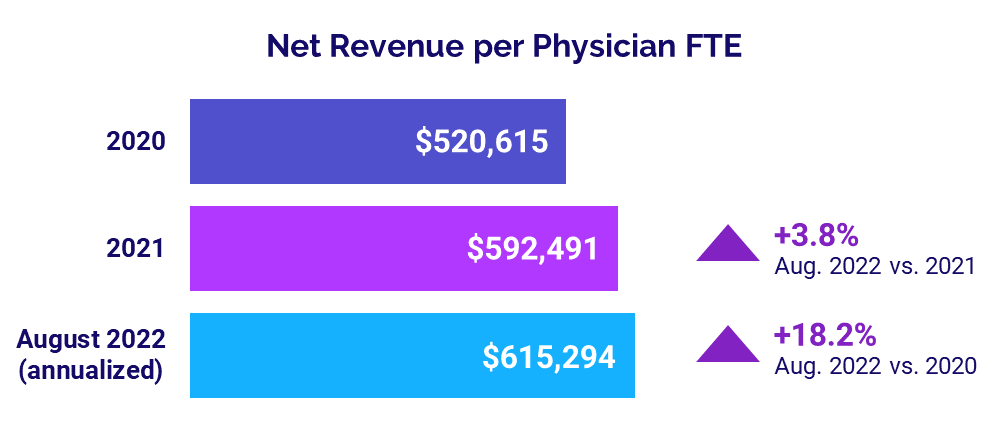
Physician revenues rose above 2021 and 2020 levels in August. The annualized median Net Revenue per Physician FTE (including advanced practice providers) for the month was $615,294, up 3.8% versus 2021 and jumping 18.2% versus the first year of the pandemic in 2020.
The metric also rose above 2021 and 2020 levels for physician practices across all regions and all specialties. Practices in the Great Plains had the biggest increase versus 2021 at 13.9%, while those in the West had the biggest increase from 2020 at 30.9%. Ob/Gyn had the biggest increases compared to different specialties, with median Net Revenue per Physician FTE up 9.3% from 2021 and up 19.4% from 2020.
Staffing Levels Decline
Staffing levels at physician practices nationwide declined in August compared to the prior two years. At a national level, annualized median Support Staff FTEs per 10,000 wRVUs were 3.02 for the month. That was down -2.2% from 2021 and down -18% from 3.68 in 2020.
The change in physician practice staffing levels varied across different practice types. Surgical Specialties practices, for example, had the biggest increase in median Support Staff FTEs per 10,000 wRVUs for 2021 at 12.5% annualized in August, but the metric was down -8.4% from 2020. Primary Care had the biggest decreases, with the metric down -6.7% from 2021 and -19.6% from 2020.
The Road Ahead for Healthcare
High operating expenses continue to plague the nation’s hospitals, health systems, physician practices, and other healthcare providers. While contract labor costs show signs of easing and some organizations saw an uptick in revenues in August, those gains to date are insufficient to counteract high labor and non-labor costs. As a result, hospital operating margins remain low, and investments needed to support physician practices remain high.
Industry leaders will need to leverage comprehensive data and analytics capabilities to help them identify viable strategies to ensure the long-term financial health of their organizations. Tools such as Syntellis’ AxiomTM Comparative Analytics enable leaders to pinpoint specific cost drivers and how those drivers affect other key performance indicators organizationwide. They then can model a range of future scenarios to help prepare for potential changes and identify the best path forward.
Source: Syntellis’ Axiom™ Comparative Analytics, which offers access to near real-time data drawn from more than 135,000 physicians from over 10,000 practices and 139 specialty categories, and from 500+ unique departments across more than 1,300 hospitals. Powered by Syntellis IQ, Comparative Analytics also provides data and comparisons specific to a single organization for visibility into how their market is evolving.
