Few could have predicted the economic turmoil that 2020 wrought, adding factors like economic uncertainty and credit quality concerns to already record-low interest rates. Like most industries, financial institutions didn’t escape those impacts, leaving leaders scrambling to assess the financial health of their institutions and their portfolios.
The true financial health of a portfolio takes into account the level of risk associated with each loan type, instrument, industry, borrower, or other dimension. A best practice approach assesses risk using risk-adjusted return on capital (RAROC), a metric defined by net income — comprised of interest income, interest expense, funds transfer pricing, and more — divided by the risk-adjusted capital assigned to each portfolio (Figure 1).
Figure 1. Calculating RAROC
Risk-based profitability analysis helps institutions better understand profit levels adjusted for risk exposure, ensuring their portfolios reflect adequate profit for risk taken. This is especially helpful when comparing returns of different products or portfolios.
Why RAROC’s the Preferred Model for Profitability
Financial institutions can look at risk-adjusted capital in two ways: economic and regulatory. An economic model is the amount of capital that a bank or credit union estimates it needs to remain solvent by absorbing unexpected losses. In contrast, the regulatory model determines the minimum capital required, given regulatory guidance and rules.
The Syntellis approach to profitability uses the economic model to calculate capital and assign it to business units and products. Clients that perform profitability analysis using the economic model generally find the amount is above regulatory minimums but below actual capital on the books.
While profitability can be viewed through several lenses, RAROC should always be one of the calculation methods used by banks and credit unions. Profitability can be viewed in dollars to understand the magnitude of profit via net income, but that calculation doesn’t explain why a portfolio is profitable — only that it is.
Return on Assets (ROA) is another common profitability metric that’s useful in comparing portfolios of different sizes, but this method doesn’t account for risk. Two portfolios or two different products can have the same ROA, but they may not carry the same amount of risk. A RAROC calculation takes into account the riskiness of the portfolio or instrument when calculating profitability — making it preferable when comparing products and portfolios of different sizes and making decisions such as which products to promote and how to price new business.
Explaining the RAROC Matrix
In the RAROC equation, the denominator accounts for risk, but how do institutions determine risk at an instrument level? The Syntellis approach uses what we call the RAROC matrix, which encompasses risk types, product groupings, and risk ratings.
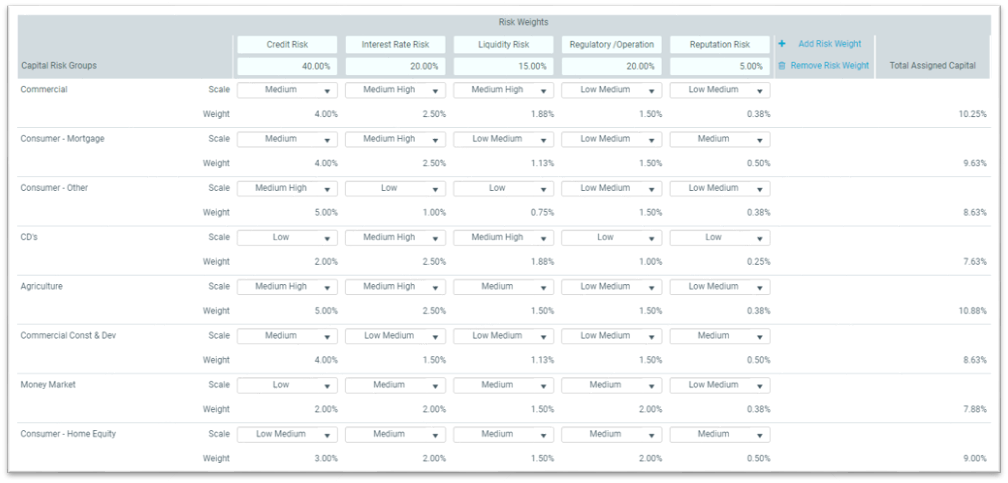
In the RAROC matrix (Figure 2), note the product groupings in the “Capital Risk Groupings” column on the left. Every instrument and every product grouping below this level will have the same amount of capital allocated to it, or at least the same percentage.
Figure 2. Sample RAROC Matrix
The next step defines the types of risk to be included in the model. For illustration, consider the five most prominent types of risks in the OCC Annual Report, listed across the top: credit risk, interest rate risk, liquidity risk, regulatory/operational, and reputation risk. Each risk receives a weight, with all risk factor weightings totaling 100%.
Finally, each product group for each risk type is rated using a graduated scale from low to high. From there, Axiom software multiplies the risk assessment by the risk factor weighting to calculate the total assigned capital for each risk group — our preferred approach to capital allocation.
Axiom makes filling out the matrix and running calculations simple. More difficult tasks include changing traditional mindsets on how to best calculate risk, and getting organizational buy-in for assumptions in the capital allocation model.
To ease the transition to RAROC, be sure to involve a cross-functional team from your institution to:
- Get input for how to approach filling out the matrix
- Provide transparency around methodology
- Explain benefits of RAROC approach
We recommend using a profitability steering committee to pave the way, gaining buy-in as you work through implementation of profitability management software and for ongoing monitoring of key performance indicators.
Syntellis’ Axiom™ FTP & Profitability can help institutions adapt their profitability analysis strategies in response to changing economic and regulatory requirements. The software provides enhanced visibility into the customers, channels, branches, and products that drive the greatest value. Measure and analyze full profit contribution and RAROC, applying a matrix-based risk assessment approach to ascribe economic capital at an account level for highest accuracy.
Check out these other resources on optimizing profitability:

The 5 Ws of Profitability Steering Committees in Banks and Credit Unions

Actionable data to guide decision-making: 10x as many reports with the same staff


