
Top 5 Healthcare Finance KPIs: April 2021
Signs of hope, but monthly fluctuations continue
Although margins, volumes, and revenues are gaining overall, monthly fluctuations continue to underscore the uneven pandemic recovery among the nation’s hospitals and health systems. April numbers for those three metrics improved year-over-year (YOY) and year-to-date (YTD) but decreased moderately compared to March 2021.
Here are the April 2021 financial KPIs for U.S. hospitals and health systems:
#1 — Operating Margins improve
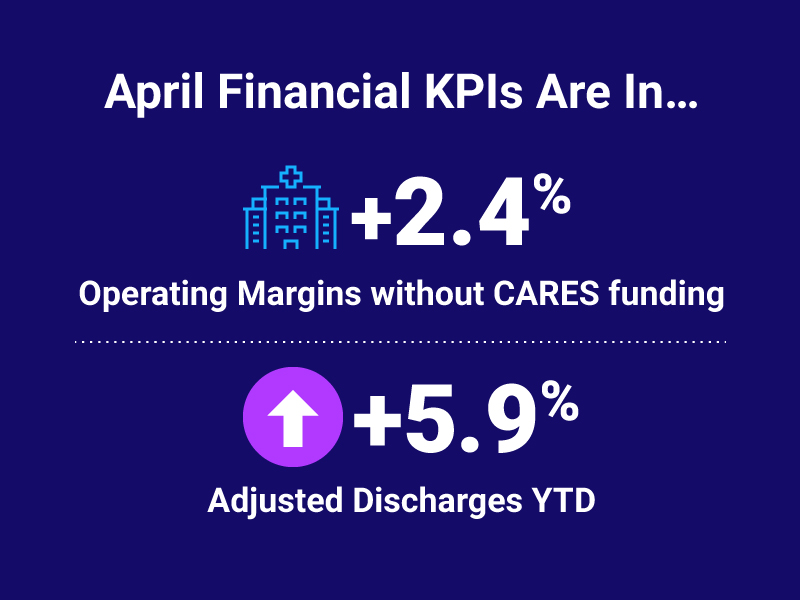
Median Operating Margin in April was 2.4% without CARES funding and 3.3% with CARES — an improvement of 1% or more on March Median Operating Revenue, which was 1.4% without and 2% with CARES.
#2 — OR Minutes higher YTD
Operating Room Minutes increased 26.1% YTD (January-April 2021) and 189.2% YOY against a near-total shutdown in April 2020, but declined 3.6% MOM.
#3 — ED Visits mixed
Emergency Department Visits increased 57.2% YOY and 5.3% month-over-month (MOM) but were down 7% compared to the first four months of 2020.
#4 — Discharges, Patient Days higher
Adjusted Discharges rose 5.9% YTD, and Adjusted Patient Days increased 10% YTD. Both metrics fell 1% MOM.
#5 — YTD Expenses increase
Total Expense increased 6.6% YTD, a combination of 6.1% higher Total Labor Expense and 7.9% higher Total Non-Labor Expense. All three metrics are down about 3% MOM.
Monthly spotlight: Revenues
Revenue numbers were higher across the board in April compared to YTD and YOY numbers but lower compared to March 2021. Gross Operating Revenue (not including CARES) improved 16.7% YTD and 71.8% YOY but was down 2.5% MOM. Likewise, Inpatient Revenue gained 10.6% YTD and 37.1% YOY but fell 1.9% compared to March.
Outpatient Revenue continues to perform well, increasing 20.3% YTD and 114.8% YOY, while decreasing just 2% MOM.
Turning data into action
As hospitals and health systems continue to recover from the devastating financial effects of the pandemic, they must better understand their cost structure related to peer organizations and other departments — down to specific physicians. Internal and external comparative data gives leaders a full financial picture of practice metrics.
In addition to aggregating data from more than 1,000 hospitals to analyze these KPIs, Axiom™ Comparative Analytics incorporates comparison data from 125,000 physicians across 10,000+ practice departments, so healthcare leaders can measure performance in a variety of dimensions, including investment and net revenue per physician FTE, practice financials, specialty, and geography. Available data includes provider compensation and productivity by named physician and support staff analysis by named APP.

Learn more about recent healthcare KPIs:

Top 10 Financial and Operational Metric Areas for Healthcare

Top 5 Healthcare Finance KPIs: March 2021
