
Top 5 Physician Practice Financial KPIs from April 2021
Physician practices nationwide continue to see improvements across several financial and operational key performance indicators (KPIs) in April 2021.* However, as revenue and productivity increase, so too do expenses, according to data from more than 125,000 physicians. Health systems will need to find a way to control costs if they want to improve profitability.
Here are the top five financial and operational KPIs from April 2021 for physician practices across the U.S.:
#1 — Volume, productivity continue to rise
So far this year, Physician wRVUs per FTE are on track for a 12.7% increase over 2020 and a 3.2% increase over 2019 values.

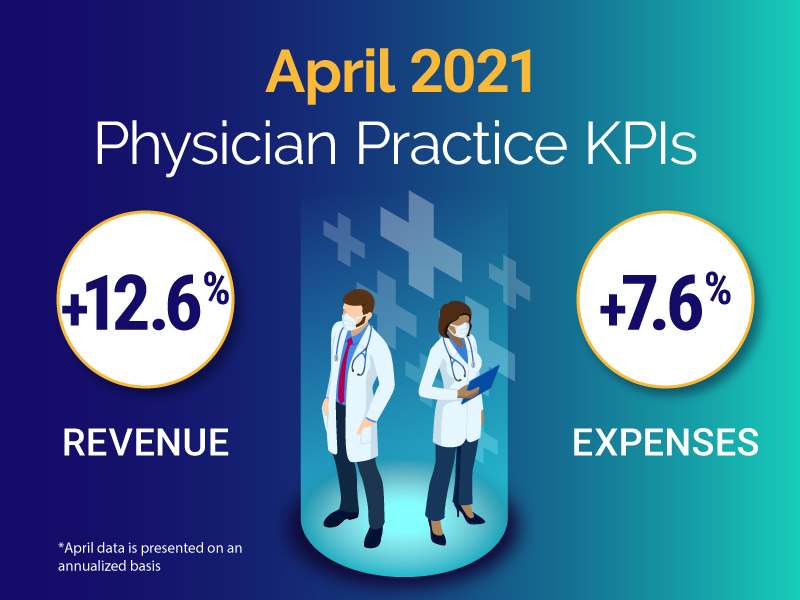
#2 — Revenue outpacing 2019 values
Revenue among physician practices is on track to outpace both 2020 and 2019 values by 12.6% and 2.6%, respectively.

#3 — Expenses remain high, must be controlled
Total Direct Expenses per Physician FTE are on the rise so far in April 2021. With a 7.6% increase over 2020 and a 7% increase over 2019, cost containment measures are vital to improving profitability.

#4 — Investment dips below 2020 levels, still higher than in 2019
Investment per Physician FTE is down -4.8% from 2020, but still 12.8% higher than in 2019. This equates to an increased investment of about $25k per physician FTE compared to 2019.

#5 — Physician compensation remains higher than pre-pandemic levels
Accompanying the increase in wRVUs, Physician Compensation per wRVU is down from 2020 by -2.1%, while holding at 1.6% higher than in 2019.

*April data is presented on an annualized basis.
Spotlight on Surgical Specialties
As the pandemic heightened in 2020, volume and productivity in surgical specialties fell 12.3% below 2019 levels. Data from the first four months of 2021 reveals that surgical specialties are on track for a more profitable year.
Here are the annualized April 2021 KPIs for surgical specialties compared to 2020:
- Physician wRVUs per FTE is 13.8% higher
- Revenue per Physician FTE is 19.2% higher
- Expense per Physician FTE is 9.6% more
- Investment per Physician FTE is 1.1% less
Recovery Efforts Require Robust Data
The data illustrates the continued financial impacts of the pandemic on physician practices. Moving forward, physician practices and the health systems that operate them need reliable data to track KPIs in real time and effectively guide recovery efforts.
Syntellis’ Axiom™ Comparative Analytics solution empowers healthcare leaders to leverage data to monitor performance across the physician enterprise, identify opportunities for improvement, and make more informed decisions.
Axiom Comparative Analytics offers access to real-time data drawn from more than 125,000 physicians from over 10,000 practices and 139 specialty categories. Healthcare finance leaders can break out the data by individual physician, non-provider staff, job code, pay type, and account levels. The data can be customized into specific peer groups — by specialty performance, regional comparisons, urban versus rural, etc. — for unparalleled comparisons to drive operational decisions and performance improvement initiatives.
Read more about physician KPIs:

Top 10 Financial and Operational Metric Areas for Healthcare
