
Top 5 Physician Practice Financial KPIs from June 2021
Physician practices nationwide saw productivity and revenues increase in the second quarter with continued increases in patient volumes. Expenses also continued to climb, while staff productivity dropped, according to data from more than 135,000 physicians nationwide. Meanwhile, the median investment per physician fell after two consecutive quarters of increases following a significant drop due to disruptions early in the pandemic. The latest data illustrates continued volatility for physician practices, highlighting the need to rein in rising expenses.
The top five financial and operational KPIs from June 2021 for U.S. physician practices are:
#1 — Per-physician investments fall for first time since Q3 2020
The median Investment per Physician Full-Time Equivalent (FTE) required to supplement physician revenues dropped 7.4% from the first quarter to $243,333 in the second quarter of 2021. The drop follows two quarters of increases since Q3 2020, when COVID-19 related disruptions caused a precipitous drop in the metric. Median Investment per Physician FTE was down 21.3% compared to Q2 of 2020. Most specialties saw decreases from Q1 to Q2 2021, with the exception of Hospital-based Specialties, which were up slightly at 2.9%.

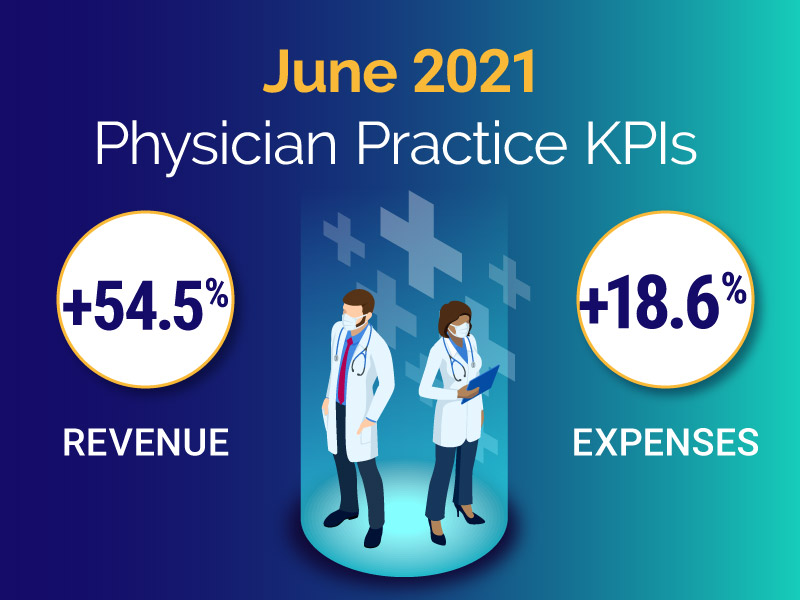
#2 — Physician revenue jumps more than 10%
As COVID-19 vaccination rates continue to rise, Net Revenue per Physician FTE (including advanced practice providers) increased to $643,420, up 54.5% from Q2 2020 and 10.2% from Q1 2021. Different specialties experienced minor fluctuations between Q3 2020 and Q1 2021, but saw larger upticks in Q2 2021. Surgical Specialties had the largest increase at 17.8%, while Hospital-Based Specialties, Medical Specialties and Obstetrics/Gynecology (OB/GYN) saw increases ranging from 9.0% to 10.1%. Primary Care had the smallest quarter-to-quarter increase at 7.2%.

#3 — Per-physician expenses continue to climb
Total Direct Expense per Physician FTE increased for a fourth consecutive quarter, rising to $886,470. That is up 3.8% from the first quarter of this year and 18.6% from the second quarter of 2020. Most specialty cohorts saw quarter-to-quarter increases ranging from 2.5% to 3.4%. Hospital-based Specialties were the outlier, with expenses down 1.2% in Q2.

#4 — Physician productivity up for a second quarter
Physician productivity — measured as wRVUs per FTE — rose 10% from Q1 to Q2 and 45.7% from Q2 2020, contributing to the increase in revenues. The uptick in Physician wRVUs per FTE marks a second quarter of increases following a 2.9% drop in Q4 2020. The metric rose quarter-to-quarter across all specialty cohorts, with Hospital-based Specialties seeing the smallest increase at 1.7% and Surgical Specialties seeing the biggest increase at 12.9%.

#5 — Support staff FTEs down following prior increases
Support Staff FTEs per 10,000 work Relative Value Units (wRVUs) dropped 4.8% from Q1 to Q2 following two quarters of slight increases, putting them down 23.6% compared to Q2 of last year. The decline in support staff FTEs coupled with the increase in physician productivity suggests that practices may be stabilizing and that leaders may need to assess appropriate staffing levels going forward. Support Staff FTEs per 10,000 wRVUs were relatively stable in OB/GYN and Medical Specialties for a second consecutive quarter, but dropped 6.6% in Primary Care and 12.7% in Surgical Specialties from Q1 to Q2.

Spotlight on Physician Investment by Regions
The median Investment per Physician FTE has fluctuated quarter-to-quarter for physician practices nationwide since dropping sharply at more than 24% for all regions in the third quarter of last year. The metric decreased across four of five regions in the second quarter of 2021. The Northeast/Mid-Atlantic was the exception, with a quarter-to-quarter increase of 3.7%.
Physician practices in the West had the largest drop in Investment per Physician FTE from Q1 to Q2 2021 at 19.9%, followed by the Midwest at 16.7%. As of Q2, Investment per Physician FTE in the West was down 22.5% compared to the same period in 2020, while the Midwest was down 43.6%.
Instability in the metric suggests that physician practices across all regions continue to experience volatility as they work to balance revenues, productivity, and staffing levels in the aftermath of last year’s losses from nationwide shutdowns and COVID-19 mitigation efforts early in the pandemic.
Recovery Efforts Require Robust Data
The data illustrates the continued financial impacts of the pandemic on physician practices. Physician practices and the health systems that operate them need reliable data to track KPIs in real time and effectively guide recovery efforts.
Syntellis’ Axiom™ Comparative Analytics solution empowers healthcare leaders to leverage data to monitor performance across the physician enterprise, identify opportunities for improvement, and make more informed decisions.
Axiom Comparative Analytics offers access to real-time data drawn from more than 135,000 physicians from over 10,000 practices and 139 specialty categories. Healthcare finance leaders can break out the data by individual physician, non-provider staff, job code, pay type, and account levels. The data can be customized into specific peer groups — by specialty performance, regional comparisons, urban versus rural, etc. — for unparalleled comparisons to drive operational decisions and performance improvement initiatives.

Read more about Physician KPI data:

Top 10 Financial and Operational Metric Areas for Healthcare
Leverage Real-Time Physician Data to Improve Practice Performance
