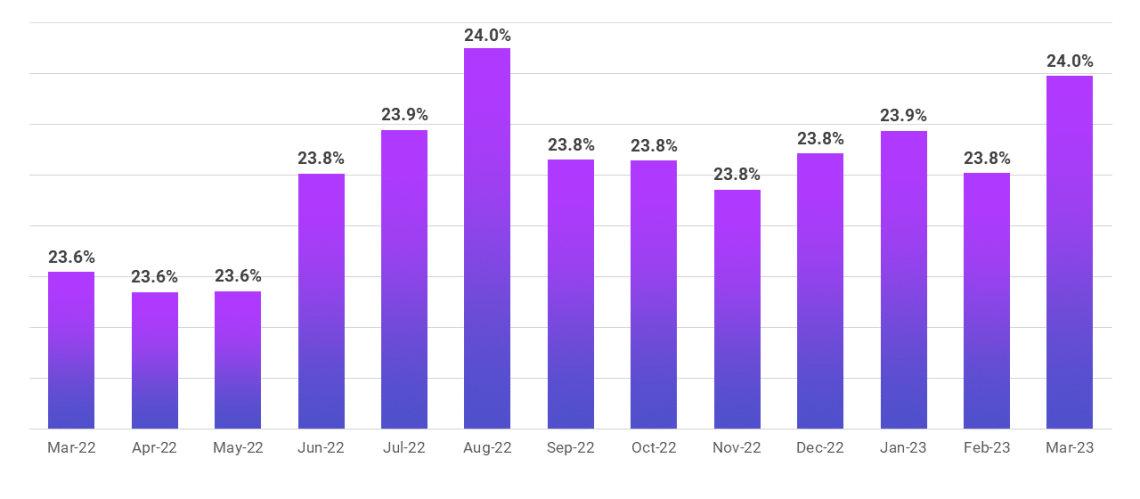
The average health system spends nearly 25% of its median expenses on corporate services, taken as a percent of net operating revenue.1 As such a significant share of overall hospital expenses, health system leaders simply cannot afford to overlook corporate services when assessing how to lower hospital costs, as discussed in a recent Healthcare Financial Management Association (HFMA) webinar.
Examples of corporate services include administration, finance, revenue cycle, human resources, information technology (IT), legal, and marketing. Why is cost reduction important in healthcare? Hospitals and health systems historically operate on tight operating margins, and incremental reductions in corporate expenses can make a huge difference. A five percentage-point reduction in corporate services costs could save an average health system in the U.S. an estimated $3.6 million annually.2
Using data and benchmarking to identify high-cost areas and build cost saving measures for hospitals can help reduce corporate expenses and divert those dollars to critical patient care services. Taking four key steps will help your organization target opportunities to reduce corporate hospital expenses:
- Measure
- Compare
- Evaluate
- Act
Step 1: Measure
Benchmarking hospital performance is a standard, long-standing practice in evaluating patient care services. Yet benchmarking is far less common in corporate services. An old adage holds true across all health system expenses: “You can't manage what you can't measure.”
The first step is to understand what to measure. Corporate services expenses can be measured in different ways. Three common metrics to consider are Expense as a Percent of Net Operating Revenue, Expense per Full-Time Equivalent (FTE), or Expense per Adjusted Discharge.
The key is to put costs into an appropriate context. For example, Expense as a Percent of Net Operating Revenue is a good general measure to use because it frames corporate services expenses within overall expenditures so you can begin to see how your organization performs compared to peers, as well as against itself.
For areas such as IT or legal, Expense per FTE can be a good measure to use because expenses in those areas typically shift significantly based on the number of FTEs. For smaller health systems with fewer FTEs, an examination of Expense per Adjusted Discharge may make more sense.
Step 2: Compare
Once you know how to measure specific services, you’ll need to determine appropriate benchmark comparisons for those metrics. Identifying the right peer groups for comparison will ensure fair, accurate, and actionable results. Common criteria to consider include your organization’s size, geographic location or region, and specific department or job code comparisons.
Again, the key is to put your health system’s performance into the right context. Making the wrong comparison can easily skew the picture and make it appear that your organization is performing much better — or much worse — than it is.
One of the first comparisons to look at is by region. As one illustration of this, labor costs can vary depending on the region due to different costs of living in different parts of the country. There can be variances within regions, too, such as between rural versus urban areas.
An urban hospital in the South might find general administration labor expenses significantly lower than the national median or peer hospitals in other regions. Compared to other hospitals in the South or within other urban areas within the South, however, those same expenses may not appear so rosy.
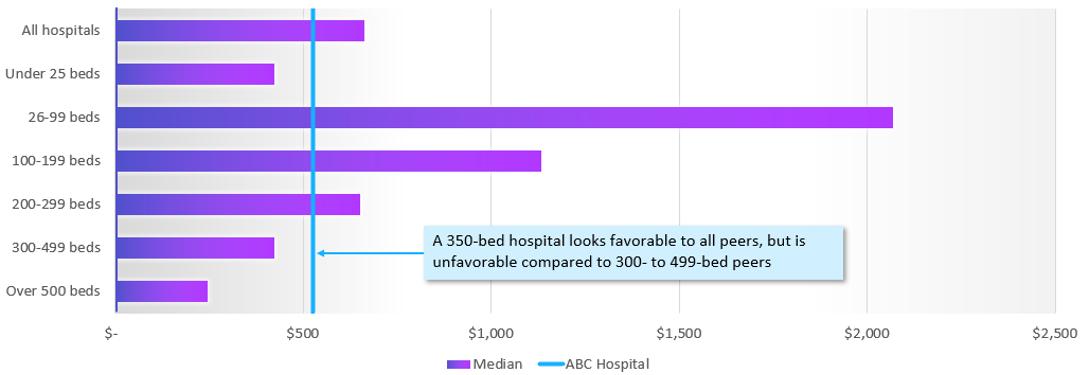
The second dimension to consider is number of beds. Many aspects of a health system’s costs are driven by its size. For instance, Expense per FTE for an IT department changes depending on your organization’s bed size. While IT Expense per FTE for a 350-bed hospital may appear favorable compared to hospitals of different bed-size cohorts, it could be unfavorable compared to like-size peer hospitals with 300-499 beds (see Figure 2).
The more granular the comparison, the better for making an apples-to-apples comparison. From region and bed-size, you can drill down further to department-level or job-code comparisons. Ultimately, finding the most relevant comparisons will show how your organization performs relative to its peers within your market.
Step 3: Evaluate
Benchmarking corporate services reveals potential cost reduction opportunities when there is a sizable variance between peer medians and actual performance at your organization. Every variance, however, does not necessarily indicate a true opportunity.
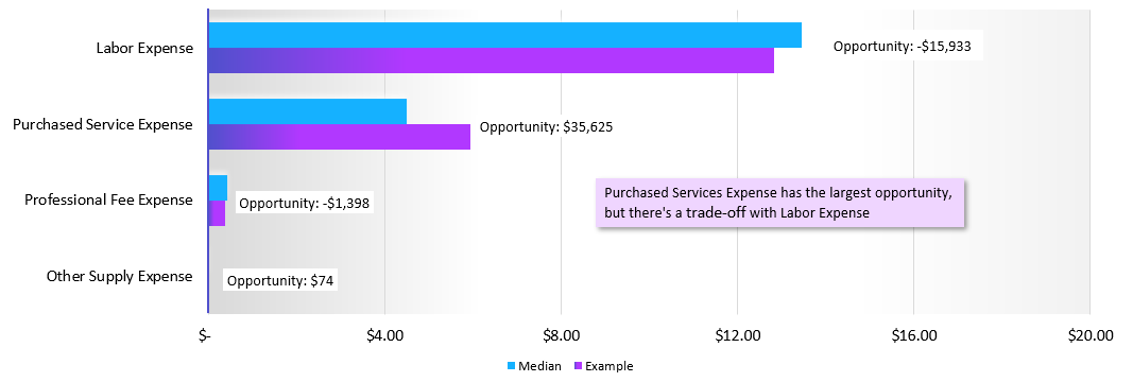
During step three, you’ll evaluate comparisons to thoroughly assess your findings and may need to make trade-offs. Hospital cost cutting strategies in purchased services, for instance, could have repercussions on labor costs if you need to hire additional FTEs to make up for those losses and maintain adequate operations.
Drilling down to department-level comparisons can reveal cost saving ideas for hospitals in areas with the largest variances. For example, let’s say an analysis of Expense per Adjusted Discharge reveals a $175,000 variance between revenue cycle expenses at your organization compared to those at peer hospitals.
Let’s evaluate further using Figure 3. Here, the Revenue Cycle Management Department’s purchased services expense appears to have the largest opportunity for cost reductions at $35,625, but we must also factor in how reductions here may increase spending elsewhere, such as labor expense. When assessing possible initiatives to reduce purchased services costs and bring them closer to median performance, remember to evaluate the impacts on labor expenses so you don’t negate the improvements in purchased services.
Everything is a balancing act. Before implementing healthcare cost control strategies, it is important to fully understand the various cost reduction opportunities and other changes those reductions might bring to your organization, both positive and negative.
Step 4: Act
Finally, it’s time to act on the hospital expense reduction ideas you identified. For this step, work together with the people who will execute the cost containment effort. In our Revenue Cycle Management Department example, finance leaders would work with those in charge of purchased services and leaders in specific departments to gain buy-in, so they can help make adjustments to offset any losses with labor or productivity increases.
Having the data and benchmarks to demonstrate the reasoning behind your actions will help build that buy-in. Clear lines of accountability and milestones to measure progress will ensure proper execution of the plan.
Strategies to reduce healthcare costs should be realistic and achievable; a phased approach often works best. For example, a health system seeking to reduce IT expenses that are in the 40th percentile of the median compared to its peers may seek to progress to the 45th percentile within the next year and the 50th within two years. The idea is to move the needle little by little to ensure sustainable results.
As with all hospital cost reduction strategies, controlling corporate services spending should be an ongoing process (see Figure 4). Organizations should continuously reevaluate their performance against an ever-changing market. Integrating hospital cost reduction and containment processes into everyday operations involves routinely going through the cycle of measuring, comparing, and evaluating benchmarks to determine viable opportunities. Without continuous improvement, costs tend to creep back in over time and can negate prior, hard-fought reductions.
Conclusion
If left unchecked, the high costs associated with corporate services can eat into already tight hospital and health system operating margins.
Healthcare leaders should continuously ask: How can hospitals cut costs? To identify cost reduction opportunities, it is important to look at costs from different angles and in different dimensions. For example, in evaluating IT expense per FTE across a large health system, you should break it down and examine measures of that metric from each individual facility within the broader system. You may find that a specific site is driving a disproportionate share of the overall costs.
Breaking down corporate services costs and measuring them against appropriate peer-group comparisons will help your organization prevent missed opportunities and avoid false opportunities. Tools such as Syntellis’ Axiom Comparative AnalyticsTM can help streamline such analyses with a robust database for benchmarking and a simplified submission process. Through continuous improvement, you can achieve sustainable cost reduction in healthcare to operate more efficiently and optimize resources for patient care.
1Syntellis’ Axiom Comparative Analytics. Syntellis Performance Solutions, 2022.
2Ibid.
Read more on comparative analytics with Axiom

Market Analysis and Monthly Hospital & Physician KPIs: February 2022

Using Healthcare Benchmarks to Improve Physician Practice Cost Containment


