Executive Summary:
March was a Mix of Losses and Gains for Most Providers
March was a mixed month for U.S. healthcare providers. Hospitals, health systems, physician practices, and other healthcare organizations continued to feel the effects of rapidly rising expenses and persistent workforce shortages. At the same time, many saw potential signs of relief from pandemic-fueled volatility and wage pressures. The 7-day moving average of new COVID-19 cases fell -53.3% throughout March to 25,573 as of March 31, down -96.8% from an all-time high of 807,522 on January 15, according to the Centers for Disease Control and Prevention (CDC).1
Providers faced ongoing, unsustainable margin pressures as the gap between revenue growth and escalating expenses widened across key departments. COVID-19 rate declines, however, lessened some operating challenges two months after the crushing Omicron surge. For example, disparities in pay for contract registered nurses (RNs) versus employed RNs narrowed significantly in March after rates for contract nurses skyrocketed in January and February.
For hospitals and health systems, operating performance fell year-over-year across most metrics but was up significantly compared to the first month of the pandemic in March 2020. The contrast in performance over the years reflects the rollercoaster hospitals have been on throughout the COVID-19 pandemic.
Physician practices also faced the combined challenges of rising expenses, workforce shortages, and increased patient demand in the first quarter of 2022. The average level of investment needed to support physician practices increased for a third consecutive quarter as a result, surpassing first-quarter 2021 levels for the first time in a year.
Read this month’s Syntellis Performance Trends report for more details on hospital and physician performance drawn from our analysis of data from more than 135,000 physicians and 1,000 hospitals. Key year-over-year results include:
- Per-unit ICU Expense vs. Revenue gap widened to 18.8 percentage points
- Contract RNs Hourly Rate dropped -10.8%
- Hospital Operating Margins decreased -38.8%
- Labor Expense per Adjusted Discharge rose +12.9%
- Median Physician Investment rose +9.8%
Steve Wasson
EVP and GM, Data and Intelligence Solutions
Syntellis Performance Solutions
Market Analysis
April 2022
March was a mixed month for U.S. healthcare providers. Many organizations continued to cope with the impacts of rapidly rising expenses, but saw possible early signs of relief from pandemic-fueled patient demands and workforce shortage-related wage pressures.
Hospitals and health systems faced ongoing, unsustainable margin pressures as the gap between revenue growth and escalating expenses widened across key departments. Meanwhile, declines in overall COVID-19 rates lessened some operating challenges two months after the devastating Omicron surge.
Disparities between pay rates for contract RNs versus employed RNs narrowed significantly in March, providing some hope for organizations struggling with high overall labor costs amid U.S. workforce shortages. The decline in COVID-19 cases also helped to ease demand on the nation’s intensive care units (ICUs) as hospitals saw fewer patients suffering severe symptoms of the virus.
Key year-over-year March 2022 metrics include:
- Medical ICU Expense vs. Revenue per Unit of Service gap = 18.8 percentage points
- Contract RNs Hourly Rate -10.8%
- Employed RNs Hourly Rate +12%
- Urgent Care Visits +20%
- Medical ICU Patient Days -3%
Expense Increases Continue to Outpace Revenues
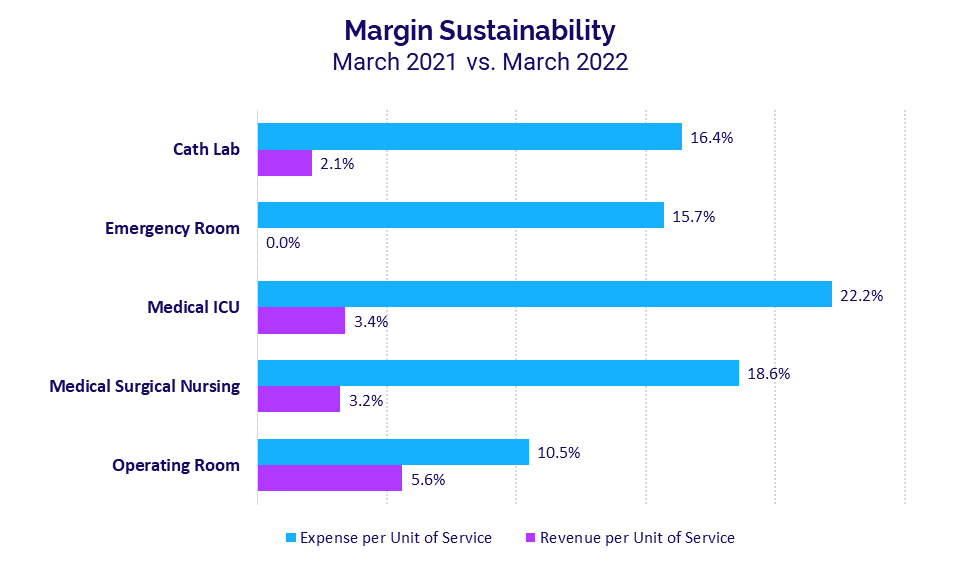
Per-unit expense increases continued to outpace per-unit revenue growth in March, with gaps between the two widening for core departments relative to the previous month. Medical ICUs again had the largest divide, with Expense per Unit of Service jumping 22.2% year-over-year in March compared to a 3.4% increase in Revenue per Unit of Service over the same period. The divide between the two metrics nearly doubled at 18.8 percentage points for the month, up from 10 percentage points in February. It was the fifth consecutive month of disproportionate increases in Medical ICU expenses versus revenues growth.
Emergency Departments had the second widest gap, with Expense per Unit of Service up 15.7% year-over-year versus no change in Revenue per Unit of Service. The 15.7 percentage-points difference between the two metrics was up from February’s 10 percentage-points difference.
Elevated Pay for Contract Nurses Eases
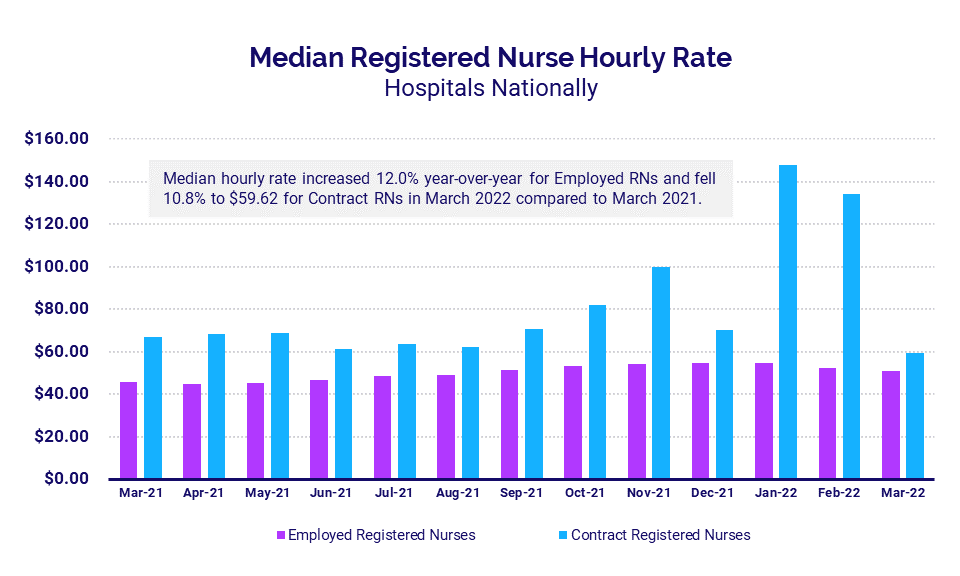
Disparities between pay rates for contract RNs versus employed RNs narrowed significantly in March, after the two metrics diverged significantly in January and February. The median hourly rate for contract RNs was $59.62 in March, down -10.8% from March 2021. By comparison, the median hourly rate for employed RNs was $51.08 for the month, up 12% year-over-year.
The shrinking divide between the two metrics offers an initial sign of potential relief for hospitals struggling with high overall labor costs amid U.S. workforce shortages. It comes after the Omicron surge fueled intense demand for healthcare workers, causing pay for contract nurses to spike at $148.20 per hour in January as hospitals sought to offset staff shortages to care for an influx of COVID-19 patients.
Urgent Care, ER Volumes Break from Pandemic Patterns
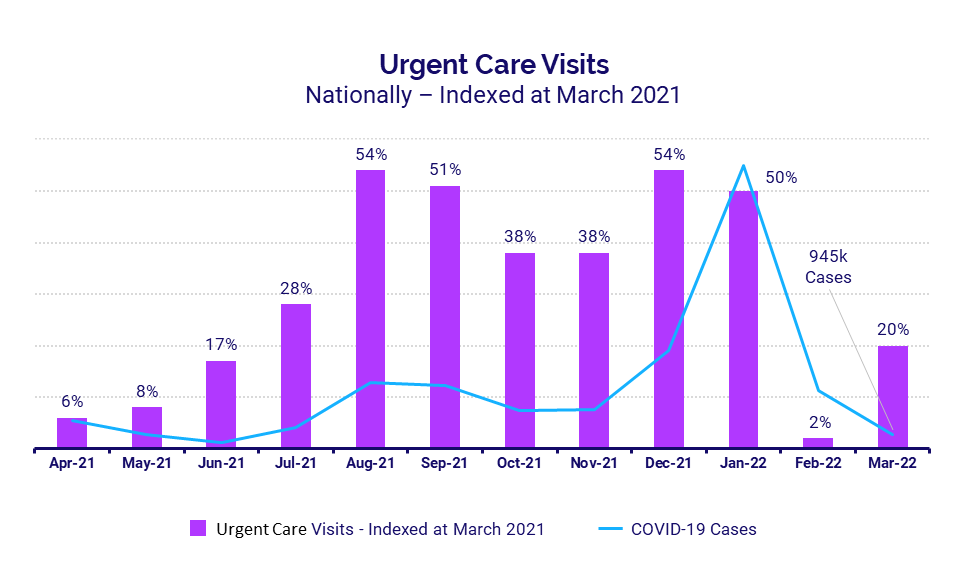
Urgent care and emergency department (ED) volumes both increased year-over-year in March. While trends for both metrics generally followed similar patterns as COVID-19 case trends over the past several months, the March results suggest the impacts of the pandemic may be lessening as COVID-19 cases continue to decline.
Urgent care visits rose 20% year-over-year in March and ED Visits increased 9% over the same period. Meanwhile, total COVID-19 cases continued to decline, dropping to 945,000 in March from January’s peak of more than 20 million.
ICU Volume, Overtime Demands Soften
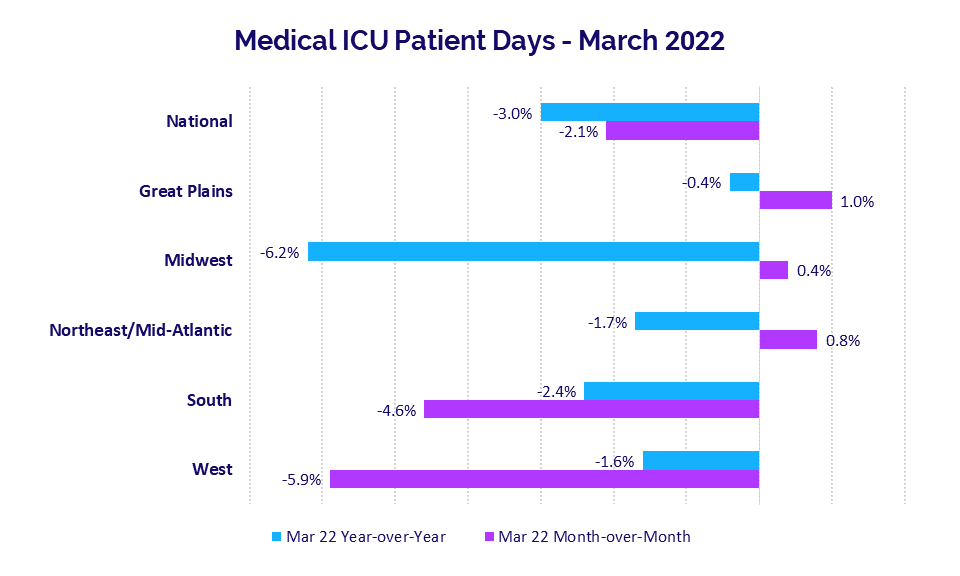
The decline in COVID-19 cases helped to ease demand on the nation’s ICUs in March as hospitals saw fewer patients suffering severe symptoms of the virus. Median Medical ICU Patient Days were down -3% year-over-year for hospitals nationwide and decreased -2.1% compared to February levels.
Hospitals in the Midwest had the largest year-over-year decline in Medical ICU Patient Days at -6.2% and were up just 0.4% month-over-month. Hospitals in the West had the biggest month-over-month decline, down -5.9% versus February and down -1.6% versus March 2021.
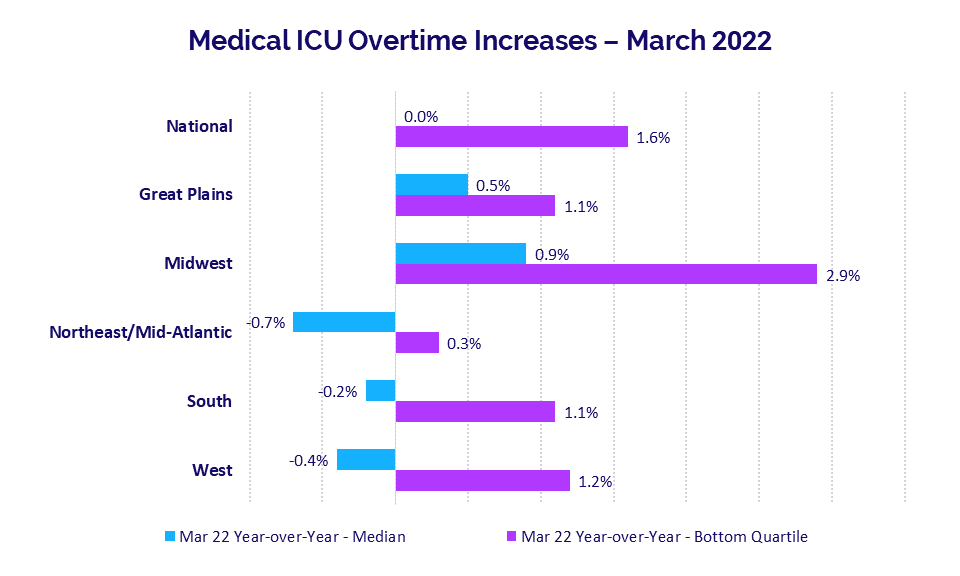
Reduced ICU patient volumes contributed to lower ICU overtime demands. Nationwide, Medical ICU Overtime was flat compared to March 2021 levels and increased just 1.6% year-over-year for hospitals in the bottom quartile experiencing the highest demand.
Median Medical ICU Overtime rates declined less than -1% year-over-year in the Northeast/Mid-Atlantic, South, and West, and increased less than 1% year-over-year in the Great Plains and Midwest.
Hospital KPIs
April 2022
U.S. hospitals and health systems faced ongoing challenges in March as operating performance fell year-over-year across most metrics two months after January’s Omicron surge. At the same time, some key performance indicators (KPIs) were up significantly compared to the first month of the pandemic in March 2020. The contrast of March performance relative to 2020 and 2021 reflects the rollercoaster hospitals have been on throughout the COVID-19 pandemic.
Median Operating Margin and median Operating Earnings Before Interest, Taxes, Depreciation, and Amortization (EBITDA) Margin both fell more than 30% below 2021 levels in March, but were up about 100% versus March 2020.
Labor expenses remained high as hospitals contend with nationwide workforce shortages, while a combination of inflation and persistent supply chain issues drove up non-labor costs. Volumes increased year-over-year across most metrics, contributing to continued revenue increases.
Year-over-year March 2022 financial KPIs for U.S. hospitals and health systems include:
- Operating Margin (without CARES): -38.8%
- Labor Expense per Adjusted Discharge: +12.9%
- Total Expense per Adjusted Discharge: +10.1%
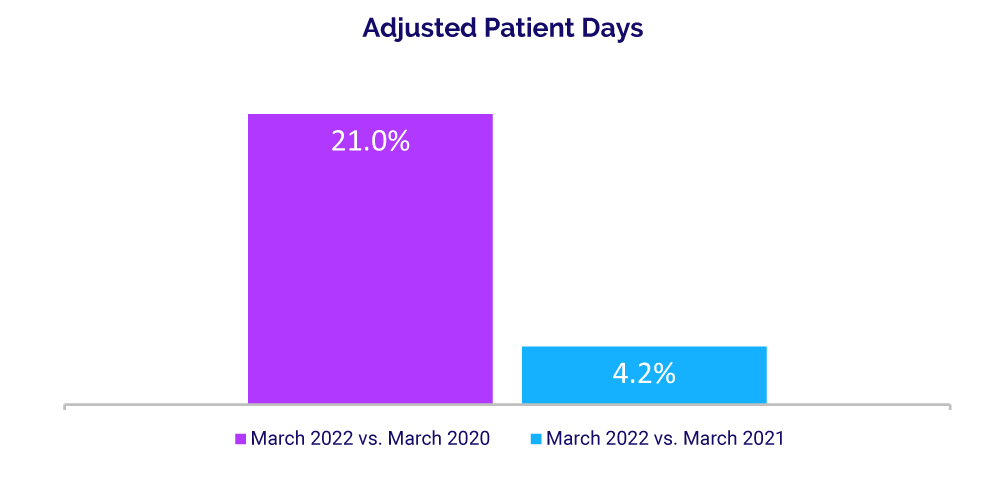
- Adjusted Patient Days: +4.2%
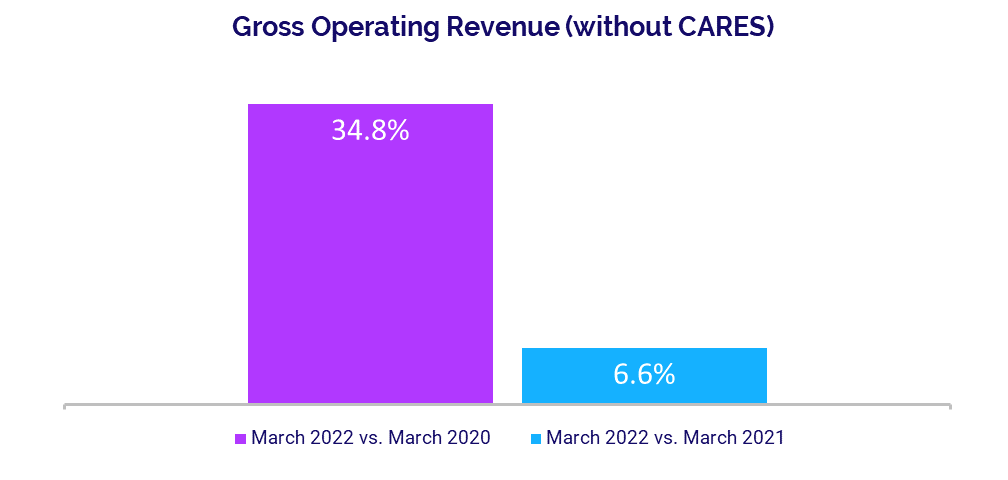
- Gross Operating Revenue: +6.6%
Operating Margins Remain Down
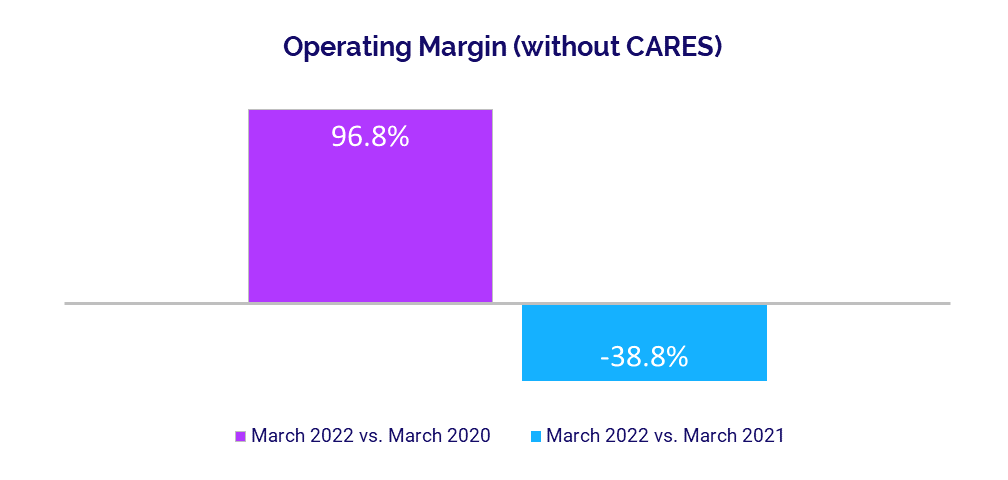
Margins continued to perform below 2021 levels in the aftermath of Omicron, but surged above levels seen at the start of the pandemic in March 2020. The median hospital Operating Margin was down -38.8% versus March 2021 but up 96.8% compared to the first month of the pandemic in March 2020, not including federal Coronavirus Aid, Relief, and Economic Security (CARES) funding.2 With CARES, the median Operating Margin was down -42.6% year-over-year but up 94.6% versus March 2020.
Operating EBITDA Margin dropped -30.5% year-over-year but rose 102.3% versus March 2020, without CARES. With CARES, the metric was down -30.7% compared to March 2021 but up 105.5% versus March 2020. Margins declined year-over-year across all regions. Hospitals in the South had the largest year-over-year drop at -44%, while hospitals in the Northeast/Mid-Atlantic had the least decline at -7%.
Labor Expenses Continue to Climb
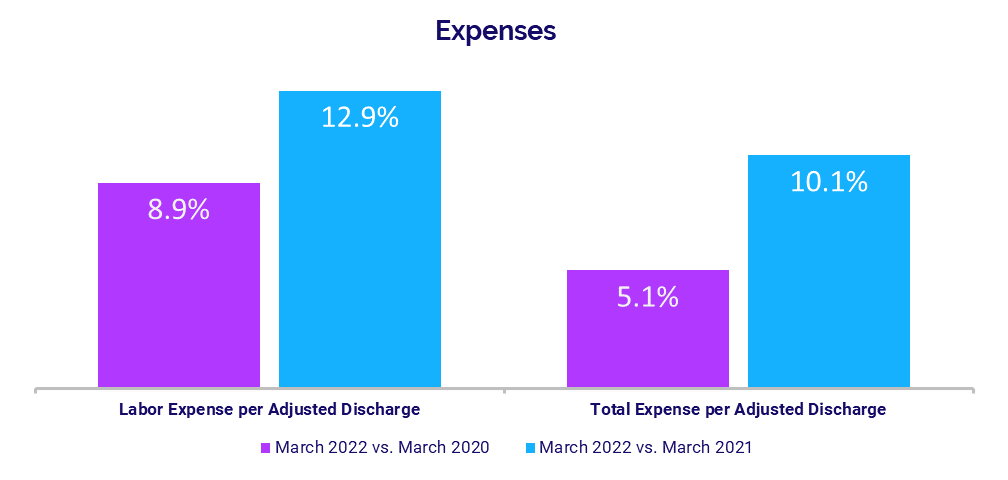
Labor Expense per Adjusted Discharge remained on the rise in March, climbing 12.9% year-over-year and 8.9% compared to March 2020. The metric increased year-over-year for hospitals in all regions, with those in the Great Plains seeing the biggest jump at 22.2%.
Wage pressures from workforce shortages continue to drive up labor costs despite decreased staffing levels. Full-Time Equivalents (FTEs) per Adjusted Occupied Bed (AOB) declined across all measures, down -4.2% versus March 2021 and down -17.1% from March 2020.
Total Expense per Adjusted Discharge increased 10.1% from March 2021 and 5.1% from March 2020. Non-Labor Expense per Adjusted Discharge was up 5.5% year-over-year and up 1.2% compared to March 2020.
Volumes See Moderate Gains
Patient volumes had moderate growth compared to March 2021, but showed significant increases compared to early pandemic lows. Adjusted Patient Days were up 4.2% from March of last year but rose 21% from March 2020. Adjusted Discharges were up just 0.1% year-over-year but rose 13.7% compared to the third month of 2020.
Average Length of Stay (LOS) continued to increase compared to prior years, up 4.6% from March 2021 and up 10.4% from March 2020. Operating Room Minutes fell just -0.7% year-over-year but jumped 39.8% versus March 2020. Emergency Department (ED) Visits were up 6% from March 2021 and up 4.7% from March 2020.
Revenues Increase Relative to Prior Years
Gross Operating Revenue rose 6.6% year-over-year in March and was up 34.8% compared to March 2020. Inpatient Revenue decreased -6.7% from March 2021 as Omicron-related hospitalizations dropped, but the metric was up 10.2% from March 2020.
Outpatient Revenue was relatively flat for the month, rising just 0.7% from March 2021. Outpatient Revenue increased 31.7% from March 2020, however, when nationwide shutdowns halted most outpatient procedures in the early months of the pandemic.
Revenue performance was mixed for hospitals across different regions. Year-over-year Net Patient Service Revenue (NPSR) per Adjusted Discharge was down less than -1% in the South, rose less than 1% in the West and Northeast/Mid-Atlantic, was up 3.5% in the Midwest, and up 11.7% in the Great Plains.
Physician Practice KPIs
April 2022
Physician practices nationwide faced the combined challenges of rising expenses, workforce shortages, and increased patient demand in the first quarter of 2022. The average level of investment needed to support physician practices increased for a third consecutive quarter as a result, surpassing first-quarter 2021 levels for the first time in a year.
Median per-physician expenses jumped nearly 10% year-over-year as practices paid higher wages in a competitive labor market, and higher supply costs driven by inflation and ongoing supply chain issues. Physician productivity also increased as patient volumes rose in the aftermath of January’s Omicron surge, contributing to higher physician revenues. Meanwhile, staffing levels declined as practices grapple with the workforce shortages and related increases in salary/wage costs.
The top five physician financial and operational KPIs for the first quarter of 2022 versus Q1 2021 are:
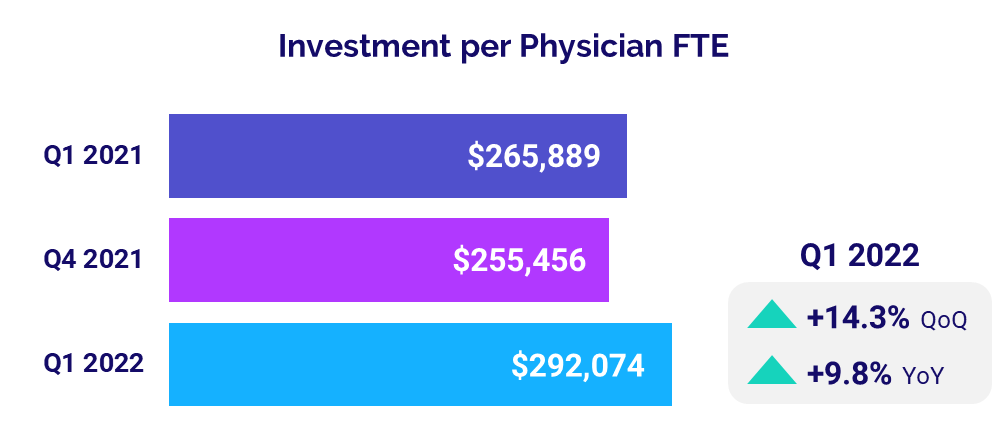
- Investment: +9.8%
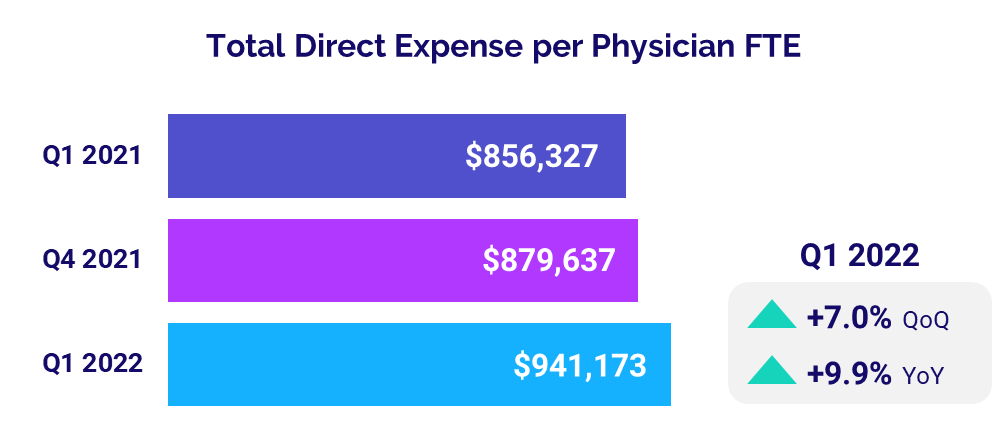
- Total Direct Expense: +9.9%
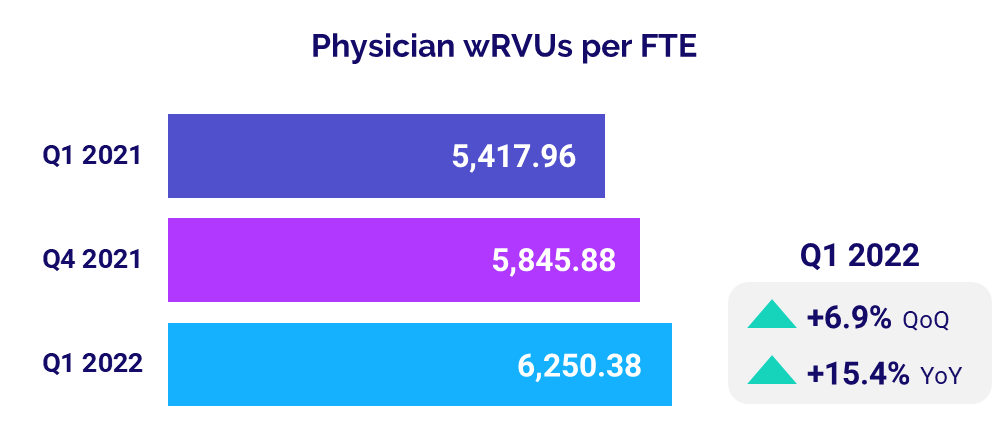
- Productivity: +15.4%
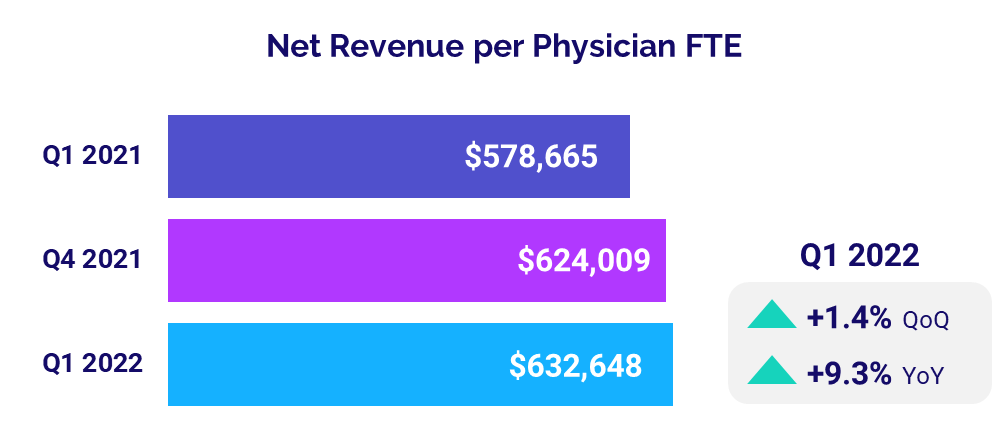
- Revenue: +9.3%
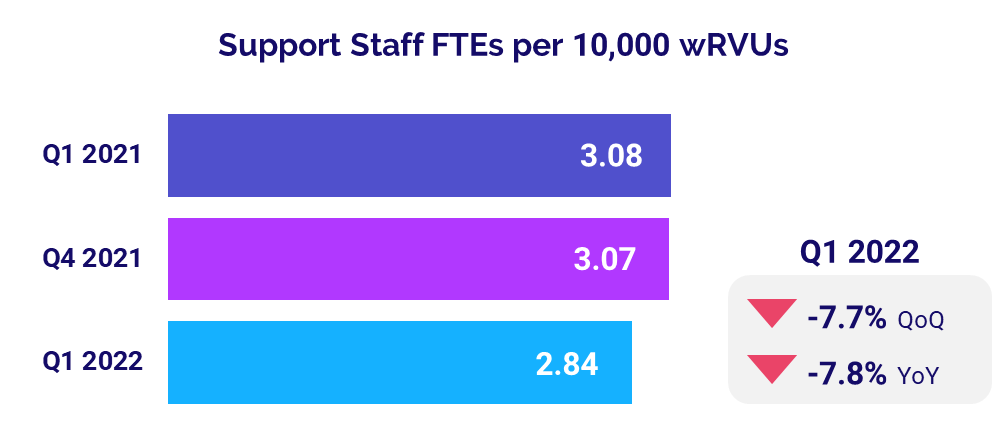
- Support Staff Levels: -7.8%
Physician Investments Surpass Early 2021
The level of investment needed to support physician practices rose for a third consecutive quarter, surpassing levels seen in the first quarter of 2021 for the first time in a year. Median Investment per Physician FTE was $292,074 in Q1 2022, up 9.8% compared to $265,889 in Q1 2021.
The median Investment per Physician FTE increased from Q1 2021 to Q1 2022 across four of five specialties. Obstetrics and Gynecology (Ob/Gyn) had the biggest increase at 25.1% year-over-year, while Primary Care was the only specialty to see a decrease at -10.8%.
Looking at different regions, Investment per Physician FTE increased for physician practices nationwide from the first quarter of last year to the first quarter of 2022. Practices in the Midwest had the biggest jump at 22.4%, while those in the Great Plains had the least increase for the period at just 1.4%.
Physician Expenses Remain on the Rise
Physician expenses continued to increase in the first quarter due to the ongoing impacts of inflation, supply chain challenges, and nationwide workforce shortages. Median Total Direct Expense per Physician FTE (including advanced practice providers) rose 9.9% from Q1 2021 to $941,173 in Q1 2022. The metric was up year-over-year for practices across all specialties. Ob/Gyn had the biggest increase at 13.7%, followed by Primary Care at 12.7%.
Physician expenses increased year-over-year for practices in four of five regions. Practices in the West had the biggest increase, with median Total Direct Expense per Physician FTE rising 19% from Q1 2021 to Q1 2022. The Great Plains was the only region to see a slight decrease for the metric at -0.5% year-over-year.
Physician Productivity Accelerates
Physician productivity increased significantly in the first quarter, rising above Q1 2021 performance due in part to a combination of increased patient demand and lower staffing levels. Median Physician work Relative Value Units (wRVUs) per FTE were up 15.4% from the first quarter of last year at 6,250.38 in Q1 2022.
Primary Care had the biggest year-over-year increase in Physician wRVUs per FTE at 17.8%, followed by Hospital-based Specialties at 17.2%. Surgical Specialties had the least year-over-year increase for the metric, at 11.7%.
Physician Revenues Continue to Grow
Higher physician productivity and increased patient demand contributed to revenue increases for the month. The median Net Revenue per Physician FTE (including advanced practice providers) increased 9.3% from the first quarter of last year to $632,648 in Q1 2022. The metric was up year-over-year across all specialty groups. Hospital-based Specialties had the biggest increase at 18.4% from Q1 2021 to Q1 2022, followed by Primary Care at 15.2%.
Physician revenues also increased across all regions in the first quarter. Practices in the West had the biggest increase, with median Net Revenue per Physician FTE jumping 23.3% from Q1 2021 to Q1 2022. The Great Plains had the least year-over-year increase for the metric at 4.5% over the same period.
Staffing Levels Drop
Physicians saw office staffing levels decline in March as practices contended with rising salary/wage costs and workforce shortages. Support Staff FTEs per 10,000 wRVUs were down -7.8% to a median of 2.84 in Q1 compared to 3.08 in the first quarter of last year.
The metric was down across three of four physician specialties. Primary Care had the biggest year-over-year decrease at -13.4%, with a median of 3.39 Support Staff FTEs per 10,000 wRVUs in Q1 2022. Ob/Gyn was the only specialty to have an increase for the metric at 1.4% year-over-year.
The Road Ahead for Healthcare
COVID-19 cases plummeted in February and March following January’s Omicron surge, and healthcare providers nationwide are beginning to see performance metrics stabilize somewhat as a result. Yet hospitals, health systems, physician groups, and other providers face continued challenges from ongoing workforce shortages, inflation, and supply chain issues.
The widening gap between growth in departmental expenses versus revenues, and persistent increases in investments needed to support physician practices are just two examples of unsustainable trends threatening the long-term stability of our nation’s healthcare providers. Even as some challenges seem to ease, others compound or arise to bring added difficulties. Many healthcare providers are functioning with fewer clinical and operational staff members than they had just two years ago, making productivity analysis increasingly important.
Reliable data and analytics are essential for healthcare leaders seeking to assess current trends, anticipate future challenges, and make informed strategic decisions that ensure greater financial stability for the long term. Productivity reporting solutions, for example, provide frontline managers with timely and accurate views of labor analytics to identify trends and productivity outliers. Such tools help healthcare leaders align labor utilization to demand so organizations can maximize productivity for the workforces they have.
Source: Syntellis’ Axiom™ Comparative Analytics, which offers access to real-time data drawn from more than 135,000 physicians from over 10,000 practices and 139 specialty categories, and from 500+ unique departments across more than 1,000 hospitals. Powered by Syntellis IQ, Comparative Analytics also provides data and comparisons specific to a single organization for visibility into how their market is evolving.
Regional data is broken down by state. The Northeast/Mid-Atlantic includes ME, VT, NH, MA, RI, CT, NY, PA, NJ, DE, MD, WV, and VA. The South includes FL, TX, LA, MS, AL, GA, SC, NC, OK, AR, TN, and KY. The Midwest includes WI, MI, IL, IN, and OH. The Great Plains includes ND, SD, NE, KS, MN, IA, and MO. The West includes CA, AZ, NM, NV, UT, CO, OR, ID, WY, WA, MT, AK, and HI.
1 Centers for Disease Control and Prevention: COVID Data Tracker, Trends in Number of COVID-19 Cases and Deaths in the U.S. Reported to the CDC, by State/Territory. Accessed April 25, 2022.
2 The lessening difference between margin performance with and without CARES reflects tapering off of funding in early 2022. Additional Phase 4 distributions in the first half of 2022 likely will increase variability again in the coming months.

