Executive Summary
High Labor Costs Continue to Strain U.S. Healthcare Providers
July was a challenging month for the nation’s hospitals, health systems, and physician practices. Key trends seen during the month include:
- Expenses remain persistently high, with growth in labor expenses continuing to outpace non-labor expense increases due to nationwide workforce shortages.
- High contract labor costs have been a major contributor to rising labor expenses as healthcare providers seek to fill workforce gaps.
- Hospital operating margins took a major hit in July due to elevated expenses and waning volumes.
- Investments needed to support physician practices continue to rise with ongoing expense increases.
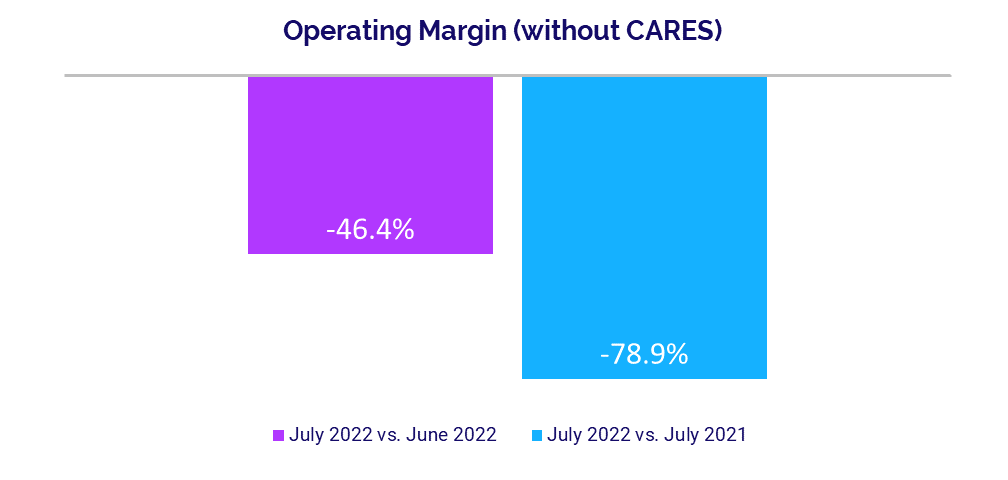
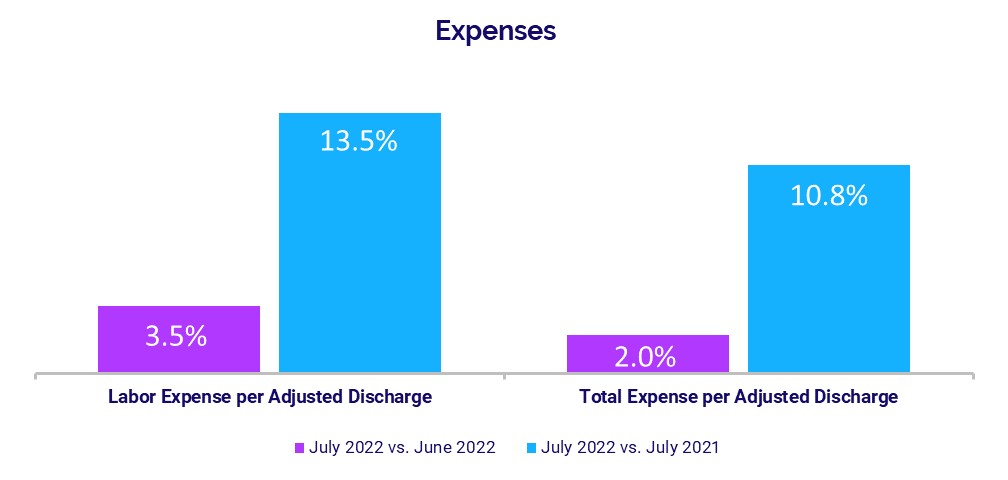
High hospital expenses in recent months contributed to stark declines in hospital operating margins in July. The median change in Operating Margin dropped -78.9% year-over-year (YOY) for the month and was down -46.4% from June to July. It was the seventh consecutive month of YOY operating margin declines and the metric’s biggest YOY drop since the second month of the pandemic, when operating margins plunged more than -281% in April 2020. At the same time, Labor Expense per Adjusted Discharge jumped 13.5% YOY in July pushing Total Expense per Adjusted Discharge up 10.8% YOY.
Hospital expenses have remained stubbornly high over the past 12 months, but growth in labor expenses has consistently outpaced non-labor expense increases as organizations continue to contend with severe workforce shortages that are impacting industries nationwide.
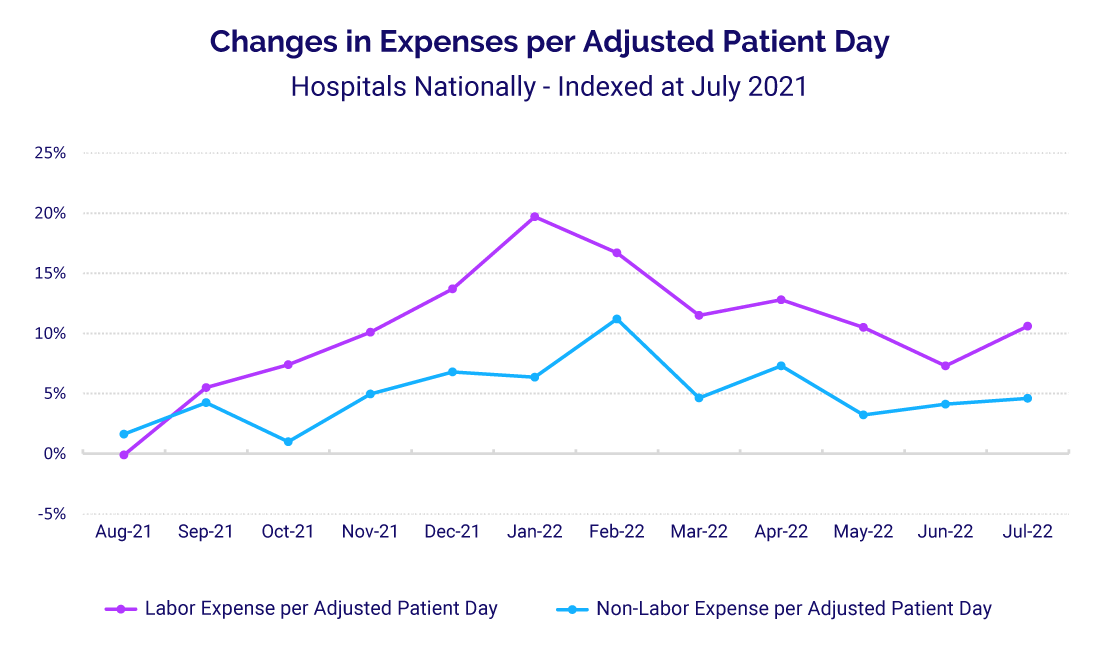
Intense demand during the Omicron surge drove the median change in Labor Expense per Adjusted Patient Day to its 12-month peak at 19.7% above a July 2021 baseline in January of this year. In July, the metric was 10.6% above the baseline. By comparison, the median change in Non-Labor Expense per Adjusted Patient Day peaked at 11.2% above a July 2021 baseline in February and was down to 4.6% above the baseline by July.
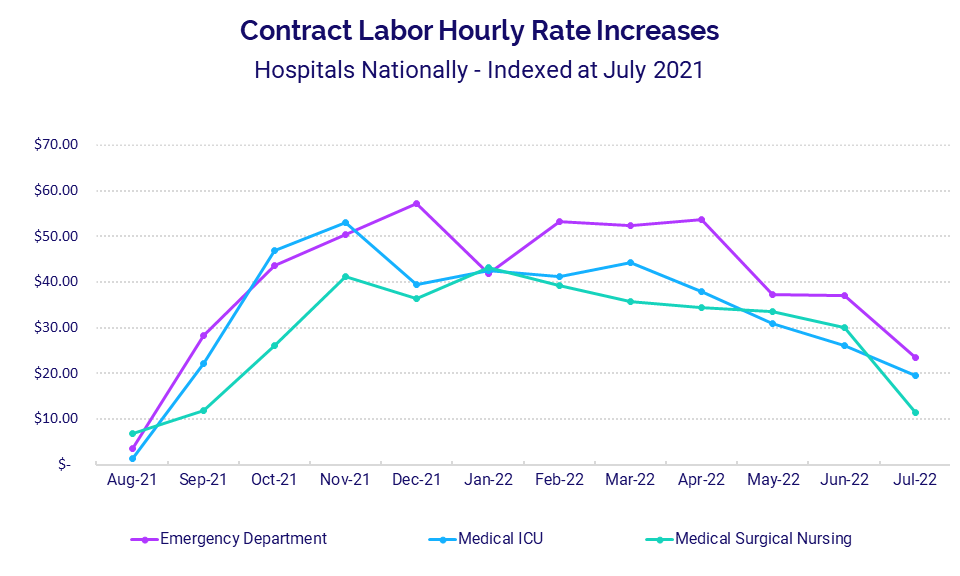
Dependence on contract labor to fill workforce gaps has been a major contributor to high expenses. Emergency Departments (EDs) had the most significant growth in contract labor costs compared to other core hospital departments, with Contract Hourly Rates rising as high as $57.28 above a July 2021 baseline rate in December 2021.
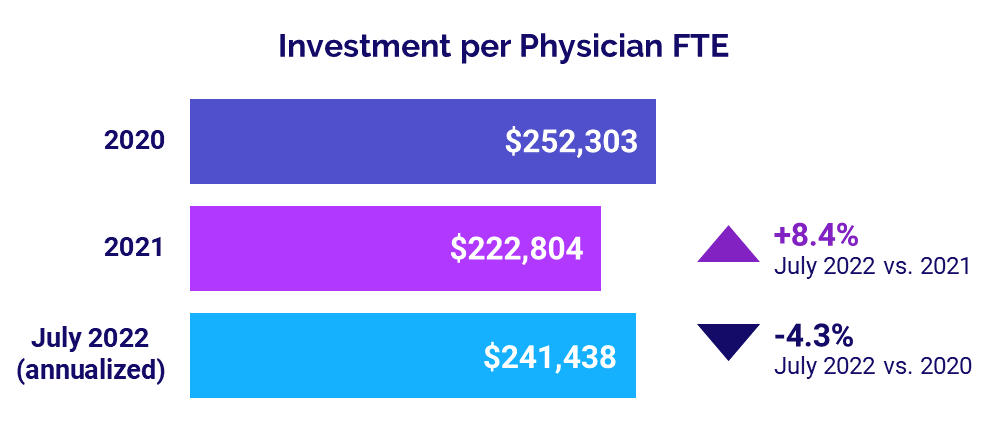
Physician practices also are feeling the pains of high costs. The annualized median investment needed to support physician practices rose to $241,438 per physician in July, up 8.4% above 2021 levels.
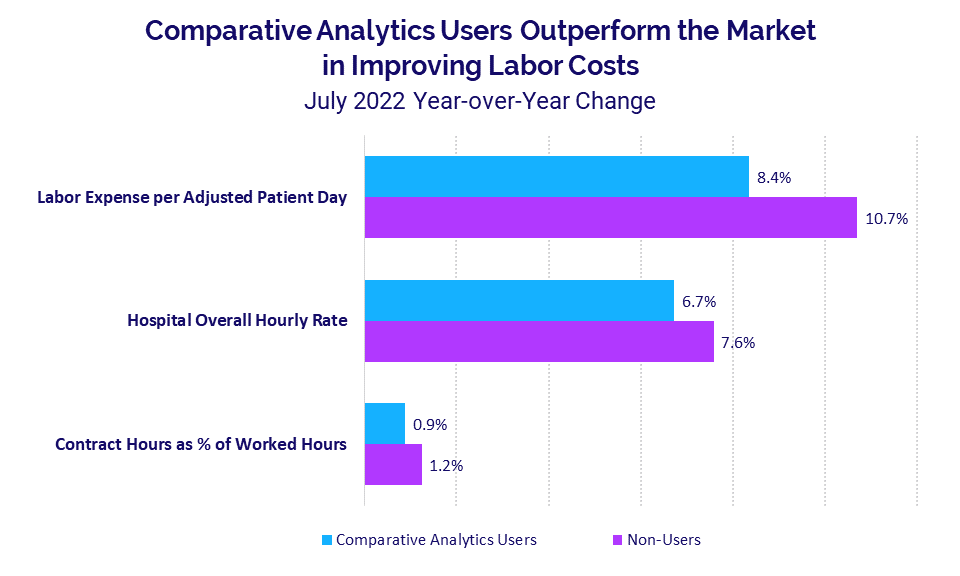
While high expenses are hurting providers across the U.S., research shows that organizations that use robust data and analytics to track key performance indicators and drive improvement strategies fare better in controlling rising costs. For example, hospitals that use such tools had an 8.4% YOY growth in Labor Expense per Adjusted Patient Day in July compared to a 10.7% increase for organizations that do not.
High expenses likely will remain a permanent challenge for healthcare providers going forward. Leveraging the power of data to monitor trends, identify opportunities for improvement, and guide financial and operational strategies is critical to adapting to this new reality.
Steve Wasson
EVP and GM, Data and Intelligence Solutions
Syntellis Performance Solutions
Market Analysis
August 2022
Key July market analysis year-over-year change metrics include:
- Labor Expense per Adjusted Patient Day +10.6%
- Non-Labor Expense per Adjusted Patient Day +4.6%
- ED Contract Hourly Rate +$23.42
- Labor Expense per Adjusted Patient Day (Syntellis’ Axiom™ Comparative Analytics users) +8.4%
- Labor Expense per Adjusted Patient Day (non-Axiom Comparative Analytics users) +10.7%
Labor Expense Growth Continues to Exceed Non-labor
Hospital expenses have remained high for the past 12 months, with growth in labor expenses consistently above growth in non-labor expenses. Compared to a baseline of July 2021, Labor Expense per Adjusted Patient Day rose 10.6% YOY in July, up from 7.3% above the baseline in June. The metric peaked at a high of 19.7% above the July 2021 baseline during the Omicron surge in January.
Non-Labor Expense per Adjusted Patient Day increased 4.6% YOY in July, up from 4.1% above the baseline the previous month. Growth in Non-Labor Expense per Adjusted Patient Day reached its highpoint of 11.2% above the July 2021 baseline in February of this year.
High Contract Labor Costs Push Up Expenses
Wide fluctuations in contact labor costs have been a major contributor to high labor expenses. Hourly rates paid to staffing firms for contract labor rose significantly starting in August 2021, but rates have declined over the past four or five months in core hospital departments.
EDs had the most significant growth, with Contract Labor Hourly Rates rising as high as $57.28 above the July 2021 rate in December 2021. In April 2022, the metric was $53.70 above the baseline, but it has decreased in the ensuing months. By July, the ED Contract Labor Hourly Rate was down to $23.42 above the July 2021 baseline.
Medical Intensive Care Unit (ICU) Contract Labor Hourly Rate spiked as high as $52.93 above the baseline in November 2021. By July, it decreased to $19.46 above the baseline. Meanwhile, the Contract Labor Hourly Rate for Medical Surgical Nursing peaked at $43.16 above the baseline in January and was $11.46 above the baseline in July.
Data & Analytics Capabilities Help Drive Better Results
A deeper look at trends in key performance indicators compared hospitals that use robust data and analytics to monitor financial performance and drive improvements versus those that do not. The analysis suggests that hospitals that use such tools fare better when it comes to controlling rising expenses.
For example, hospitals that use Syntellis’ Axiom Comparative Analytics had an 8.4% YOY growth in Labor Expense per Adjusted Patient Day in July while non-users saw a higher increase of 10.7% YOY.
Comparative Analytics users also were more successful containing pay increases over the past year. Their Hospital Overall Hourly Rate rose 6.7% in July versus July 2021 compared to a 7.6% increase for non-Comparative Analytics users over the same period. Contract Hours as a Percent of Worked Hours were up 0.9% YOY for Comparative Analytics users versus a 1.2% increase for non-users.
Hospital KPIs
August 2022
The top five financial KPIs for U.S. hospitals and health systems for July 2022 versus the same month last year are:
- Operating Margin (without CARES): -78.9%
- Labor Expense per Adjusted Discharge: +13.5%
- Total Expense per Adjusted Discharge: +10.8%
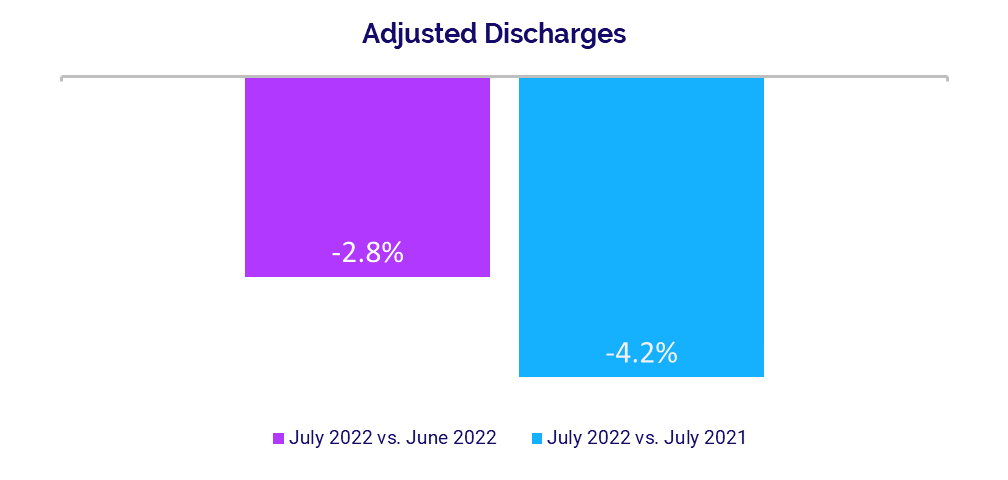
- Adjusted Discharges: -4.2%
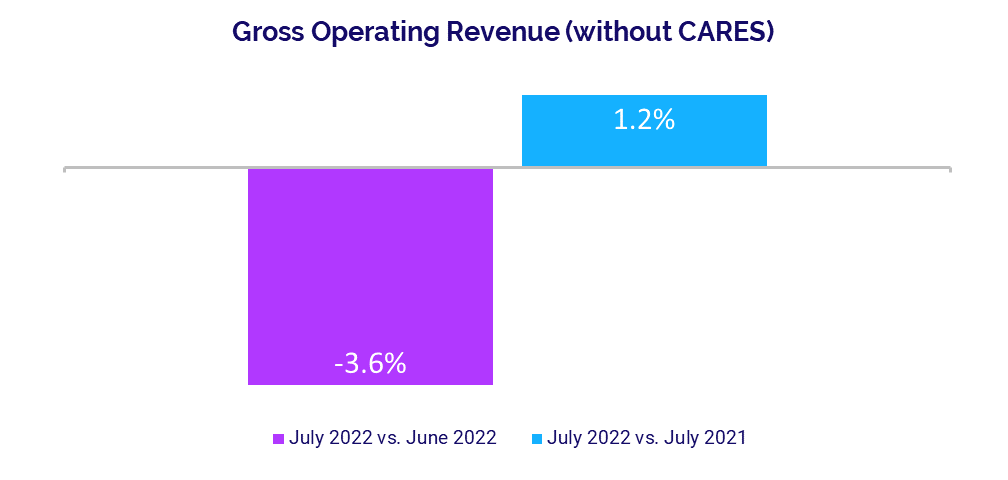
- Gross Operating Revenue: +1.2%
Hospitals See Steep Margin Declines
Expense pressures continued to hit U.S. hospitals and health systems in July, contributing to a seventh consecutive month of YOY operating margin declines.
The median change in Operating Margin plunged -78.9% YOY for the month, not including federal Coronavirus Aid, Relief, and Economic Security (CARES) Act funding.1 The decrease marked the biggest drop in margins since the second month of the COVID-19 pandemic in April 2020. Month-over-month, the metric was down -46.4% from June to July.
The median change in Operating Earnings Before Interest, Taxes, Depreciation, and Amortization (EBITDA) Margin (less CARES) decreased -49.9% YOY and -35.5% month-over-month. Operating EBITDA Margin was down for hospitals across all regions in July, with decreases ranging from -37% for hospitals in the Northeast/Mid-Atlantic to -75% in the Midwest.
Expenses Continue to Climb
Adjusted hospital expenses continued to rise across most measures in July, both YOY and month-over-month. Labor Expense per Adjusted Discharge again had the biggest increase, jumping 13.5% YOY and 3.5% month-over-month.
Total Expense per Adjusted Discharge was up 10.8% YOY and 2% from June to July, while Non-Labor Expense per Adjusted Discharge rose 6.4% YOY and was nearly flat month-over-month, up just 0.3%. Both Supply Expense and Drug Expense per Adjusted Discharge also rose YOY but decreased compared to the prior month at -4.8% and -2.1%, respectively.
Total Expense per Adjusted Discharge rose YOY for hospitals across all regions for the month, with those in the West seeing the biggest jump at 20.5%. Labor Expense per Adjusted Discharge increased YOY for hospitals in four of five regions, but it was essentially flat in the Great Plains with a decrease of just -0.1%.
Volume Recovery Wanes
Volumes again had moderate to poor performance across most metrics in July, following similar patterns seen in recent months. Adjusted Discharges decreased -4.2% YOY and -2.8% month-over-month, while Adjusted Patient Days were down -2.4% YOY and nearly flat, declining just -0.2% versus June.
Average Length of Stay and ED Visits increased 3.4% YOY and 0.7% YOY, respectively, while Operating Room Minutes dropped -7.7% YOY.
Adjusted Discharges decreased YOY for hospitals in four of five regions, with those in the West seeing the biggest median decline at -9.4%. Only hospitals in the Great Plains had an increase in Adjusted Discharges at 7.4% YOY.
Revenues See Mixed Performance
Hospital revenue performance also lagged in July. Gross Operating Revenue was up slightly at 1.2% YOY but down -3.6% month-over-month, due largely to a decline in outpatient revenue from June to July. Outpatient Revenue rose just 0.6% YOY but dropped -4.8% month-over-month. Inpatient Revenue was down -1.5% YOY and -0.7% month-over-month.
Net Patient Service Revenue (NPSR) per Adjusted Discharge declined -0.9% YOY and was down -1.8% versus the previous month. Revenue performance was mixed for hospitals in different regions. Hospitals in the Northeast/Mid-Atlantic had the biggest increase in NPSR per Adjusted Discharge at 5.7% YOY, but the metric declined -5.9% or more YOY for hospitals in the Great Plains and South.
Physician Practice KPIs
August 2022
The top five physician financial and operational KPIs for July 2022 annualized versus 2021 were:
- Investment: +8.4%
- Total Direct Expense: +7.7%
- Productivity: +2.3%
- Revenue: +2.1%
- Support Staff Levels: +0.6%
Physician Investments Hold Above 2021
Investments needed to support physician practices surpassed 2021 levels in July but fell below levels seen in the first year of the COVID-19 pandemic in 2020. The median Investment per Physician Full-Time Equivalent (FTE) was $241,438 for July annualized. That is up 8.4% compared to 2021 but -4.3% below the median of $252,303 in 2020.
The July annualized median Investment per Physician FTE rose above 2021 levels for practices in all U.S. regions, but those in the West had the largest increase at 36.3%. The metric also rose for practices in four of five regions versus 2020 levels. The Great Plains was the exception, with the metric dropping -39.8% versus 2020.
Median Investment per Physician FTE also rose for physician practices in all specialties compared to 2021 and in four of five specialties versus 2020 for July (annualized). Obstetrics and Gynecology (Ob/Gyn) had the biggest increase from 2021 at 25.4% and Primary Care was the only specialty to see a decrease compared to 2020 at -19.5%.
Physician Expenses Continue to Mount
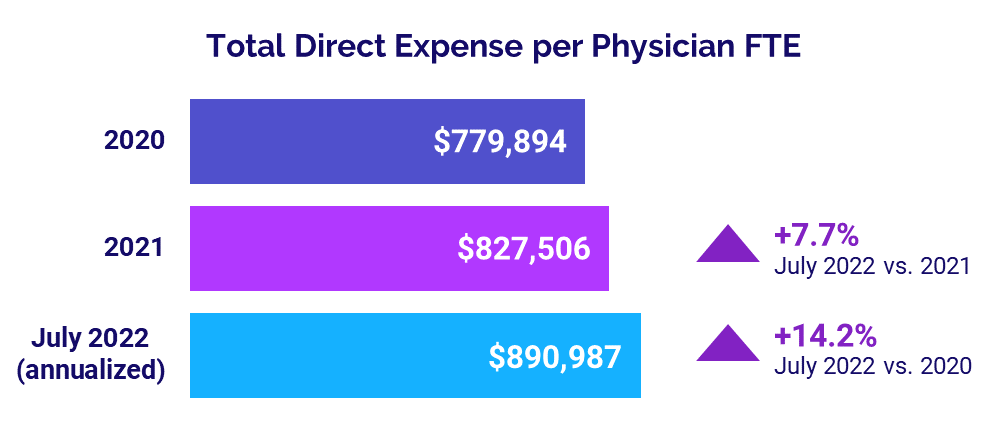
Physician practices nationwide continued to see expenses escalate in July. The median Total Direct Expense per Physician FTE (including advanced practice providers) was $890,987 for July annualized, up 7.7% from 2021 and up 14.2% from 2020.
July annualized median Total Direct Expense per Physician FTE rose for practices in all regions compared to both 2021 and 2020. Those in the Northeast/Mid-Atlantic had the biggest increases, with the metric up 11.8% versus 2021 and 17.6% compared to 2020.
Expenses also rose for practices across all specialties compared to both 2021 and 2020. Primary Care had the largest increases with July annualized median Total Direct Expense per Physician FTE jumping 9.9% versus 2021 and 17.8% compared to 2020.
Physician Productivity Increases
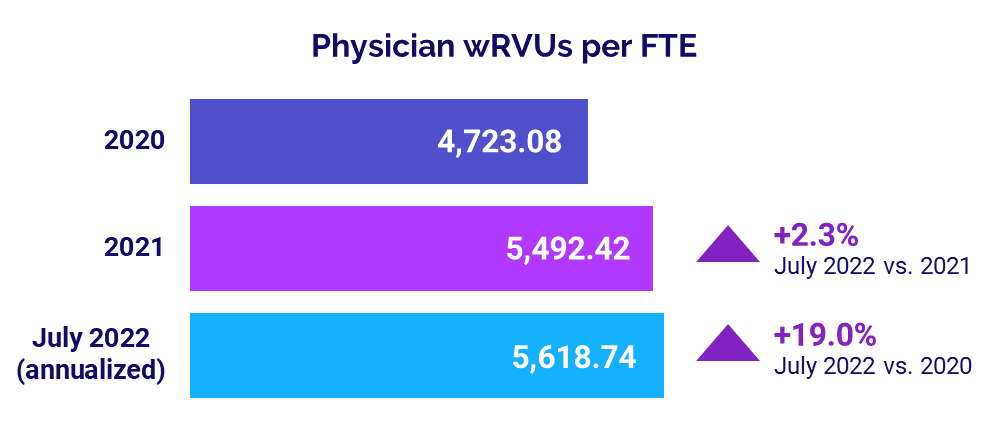
Physician productivity remained on the rise in July, increasing above levels seen in 2021 and 2020. The annualized median Physician work Relative Value Units (wRVUs) per FTE were 5,618.74 for the month. That was up 2.3% from 2021 and up 19% from 4,723.08 in 2020.
Median Physician wRVUs per FTE rose across all specialties in July (annualized) versus both 2021 and 2020. Ob/Gyn had the biggest increases, with the metric up 16% compared to 2021 and up 29.8% from 2020.
Physician Revenues Above Prior Year
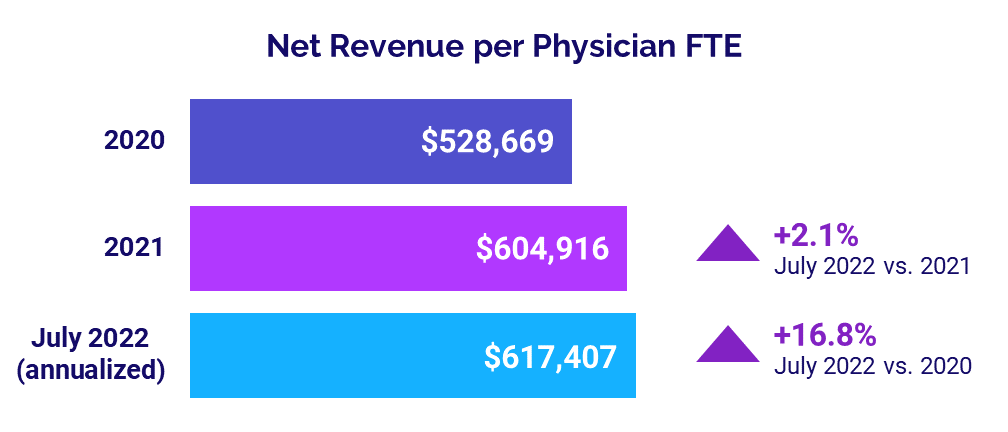
Physician revenues inched above 2021 levels in July. The annualized median Net Revenue per Physician FTE (including advanced practice providers) for the month was $617,407, up 2.1% compared to last year. Compared to 2020, however, the metric jumped 16.8%.
Median Net Revenue per Physician FTE rose above 2021 and 2020 levels for physician practices across all regions. Practices in the West had the biggest increases at 10.4% versus 2021 and 29.3% versus 2020.
Revenues also increased for practices across most specialties compared to the previous two years. Ob/Gyn had the biggest increases, with July annualized median Net Revenue per Physician FTE up 9.2% versus 2021 and up 20.9% versus 2020. Surgical Specialties were the only cohort to see a decrease, with the metric down slightly at -0.5% from 2021.
Staffing Levels Nearly Flat vs. 2021
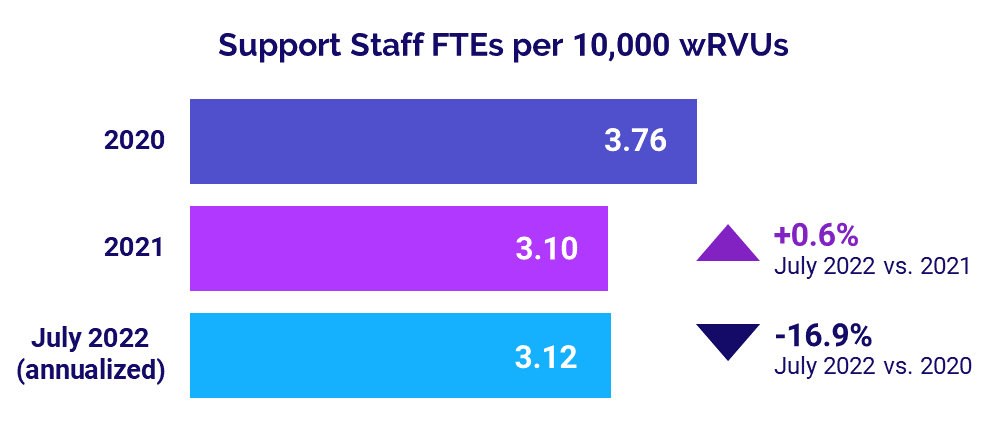
Physician practice staffing levels — measured as median Support Staff FTEs per 10,000 wRVUs — were essentially flat in July compared to 2021. On an annualized basis, the metric rose just 0.6% compared to last year’s levels. Compared to the first year of the pandemic in 2020, however, the metric dropped -16.9%.
The July annualized median Support Staff FTEs per 10,000 wRVUs increased across three of four specialties compared to 2021. Surgical Specialties had the biggest increase at 12.5% and Primary Care was the one cohort to see a decline at -2.2% versus 2021. The metric was down across all specialties compared to 2020, with Primary Care having the biggest drop at -15.9%.
The Road Ahead for Healthcare
High expenses are becoming the norm for the nation’s healthcare providers, and the repercussions are increasingly stark. Each month since the start of the year, hospital operating margins have fallen below 2021 levels while investments needed to support physician practices have risen above 2021 levels. Healthcare leaders must find ways to adapt to higher costs and curtail additional increases.
Having comprehensive data and analytics capabilities are key to tracking cost trends on an ongoing basis and being proactive in defining financial and operational improvement strategies. Healthcare leaders need to fully understand costs and cost drivers, as well as how changes in various metrics affect other key performance indicators.
As shown in this month’s report, solutions such as Axiom Comparative Analytics provide an invaluable tool for healthcare providers in combatting expense challenges. They provide reliable and timely data and give finance leaders the ability to pinpoint variations at the service line level and model those changes over time for informed decision-making to better shape their organizations’ futures.
1Due to a minimal difference between margin performance with and without CARES as funding tapers off, this report only includes median margin changes without CARES.
Source: Syntellis’ Axiom™ Comparative Analytics, which offers access to near real-time data drawn from more than 135,000 physicians from over 10,000 practices and 139 specialty categories, and from 500+ unique departments across more than 1,000 hospitals. Powered by Syntellis IQ, Comparative Analytics also provides data and comparisons specific to a single organization for visibility into how their market is evolving.
