Executive Summary
Healthcare Providers See a Rough Start to 2022 as Omicron Peaks in January
The start of the new year brought profound challenges for hospitals, health systems, physician practices, and other healthcare providers nationwide as they felt the mammoth impacts of the largest COVID-19 surge to date. Rapid spread of the highly infectious Omicron variant drove new COVID-19 cases to a pinnacle of more than 807,000 mid-month, more than triple the previous peak in January 2021, according to Centers for Disease Control and Prevention (CDC) data1. The surge set off a series of ripple effects across healthcare.
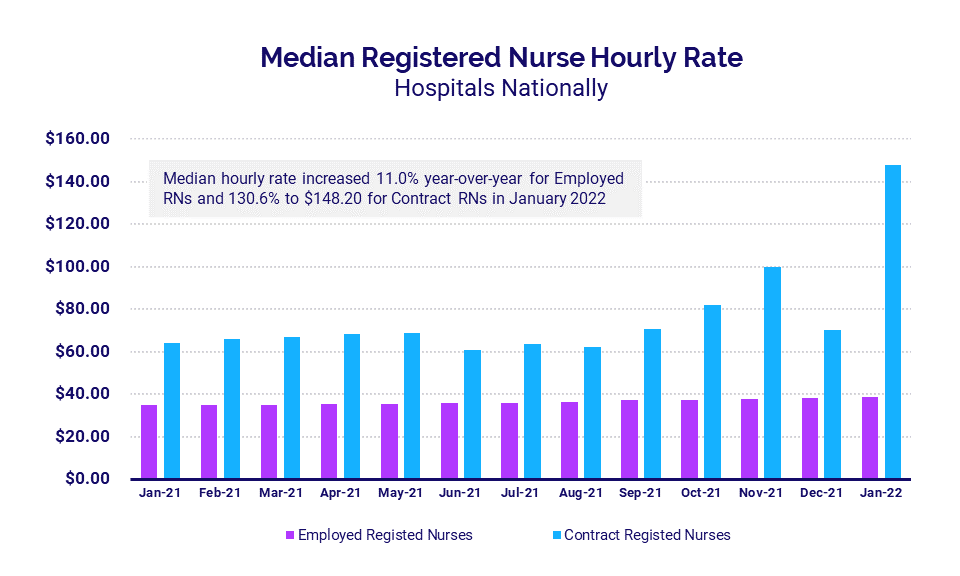
Hourly rates for contract nurses skyrocketed as competition intensified for a limited pool of registered nurses (RNs) amid mounting U.S. workforce shortages. Urgent care visits rose and patients suffering severe COVID-19 symptoms filled intensive care units (ICUs), driving up ICU volumes and overtime.
Many providers were forced to delay elective procedures to reduce Omicron’s spread and divert hospital resources to care for the seriously ill. COVID-19 mitigation efforts led to a precipitous drop in surgery volumes and outpatient care, causing hospital Operating Margins to plummet.
At the same time, hospitals saw a significant increase in sicker patients requiring longer hospital stays, and expenses continued to climb due to the workforce shortages and global supply chain issues. Annual physician data from 2021 shows sizable expense increases as they, too, felt the effects of workforce shortages.
Read this month’s report for these and other trends in hospital and physician performance drawn from Syntellis’ analysis of data from more than 135,000 physicians and 1,000 hospitals. Key year-over-year results from January 2022 include:
- Contract RNs Hourly Rate jumped +130.6%
- Urgent Care Visits increased +44%
- Medical ICU Patient Days rose +5%
- Hospital Operating Margins plunged –26.2% (without federal aid)
- Hospital Labor Expense per Adjusted Discharge rose +13%
Steve Wasson
EVP and GM, Data and Intelligence Solutions
Syntellis Performance Solutions
Market Analysis
February 2022
Rapid spread of the highly infectious Omicron variant had broad repercussions across healthcare in January. The 7-day moving average of new COVID-19 cases surged to a peak of 807,108 on January 15, according to the CDC. That’s up nearly 830% from early December when Omicron was first emerging in the U.S., and more than triple the rates seen during the prior peak in new cases in January 2021.
The surge contributed to skyrocketing hourly rates for contract nurses as competition intensified for a limited pool of RNs amid nationwide workforce shortages. The spike in COVID-19 cases also drove an increase in urgent care visits as many sought alternative care sites, COVID-19 testing, or care for less severe symptoms of the virus.
Patients with acute COVID-19 cases filled ICUs, driving up Medical ICU Patient Days and overtime rates. Meanwhile, Operating Room Minutes dropped dramatically as many providers delayed elective procedures to limit the spread of Omicron and divert hospital resources to seriously ill patients.
Key market analysis metrics from January 2022 include:
- Contract RNs Hourly Rate +130.6% (year-over-year)
- Urgent Care Visits +44% (year-over-year)
- Medical ICU Patient Days +5% (year-over-year)
- Medical ICU Overtime in the Midwest +5.7% (year-over-year)
- Operating Room Minutes in the West -21% (vs. December 2021)
Contract nursing pay skyrockets
Already tight competition for contract and travel nurses intensified in January as hospitals nationwide felt the impacts of the Omicron surge. Because the variant is so transmissible, many providers faced added workforce shortages due to quarantining of infected staff members coupled with increased care demands for infected patients. Providers had to increase their reliance on contract nurses.
The median hourly rate for contract RNs spiked to an all-time high of $148.20 for the month as a result, up 110% from $70.50 per hour in December 2021 and 48% higher than the previous peak of $99.90 per hour in November 2021. The median hourly rate for employed RNs remained significantly lower at $38.84, up just 55 cents per hour from the previous month.
Urgent care visits increase with Omicron
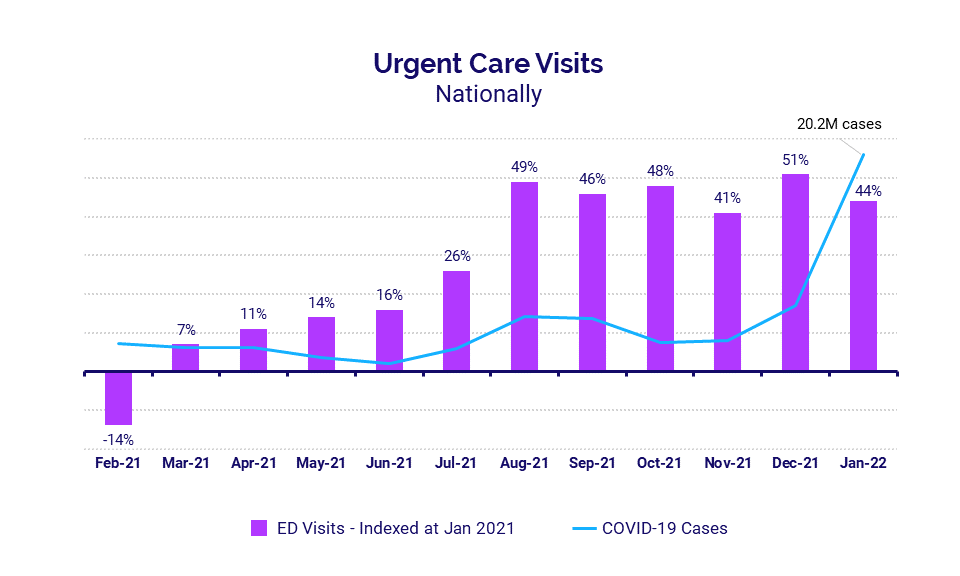
Urgent care volumes rose in January as they continued to track a path similar to COVID-19 case trends. Urgent Care Visits were up as rapid spread of Omicron pushed total new COVID-19 cases throughout the month to a high of 20.2 million in January.2
Because symptoms of Omicron are generally milder for most people compared to other coronavirus variants, patients were more likely to seek treatment in urgent care centers. An increase in patients seeking alternative care sites and COVID-19 testing also contributed to the rise in urgent care visits.
Surge amplifies ICU volumes, overtime demands
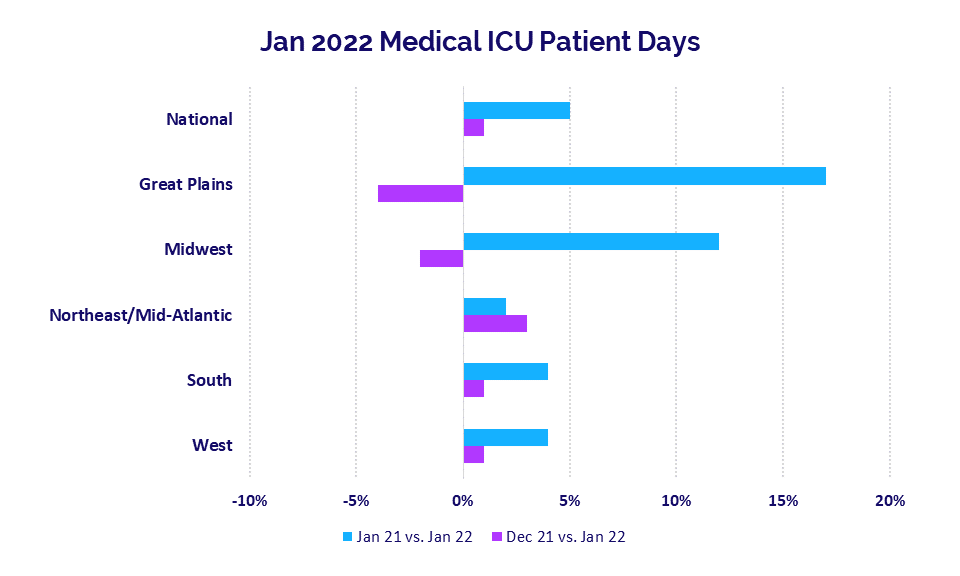
The Omicron surge contributed to a sizable increase in ICU demand in January. Median Medical ICU Patient Days rose 5% year-over-year nationwide. Hospitals in the Great Plains and Midwest had the biggest increases at 17% and 12% over the same period, respectively.
Month-over-month compared to December 2021, however, Medical ICU Patient Days were down -4% in the Great Plains and down -2% in the Midwest. Hospitals in the Northeast/Mid-Atlantic, South, and West all saw Medical ICU Patient Days increase both month-over-month and year-over-year in January as the variant quickly spread across the country.
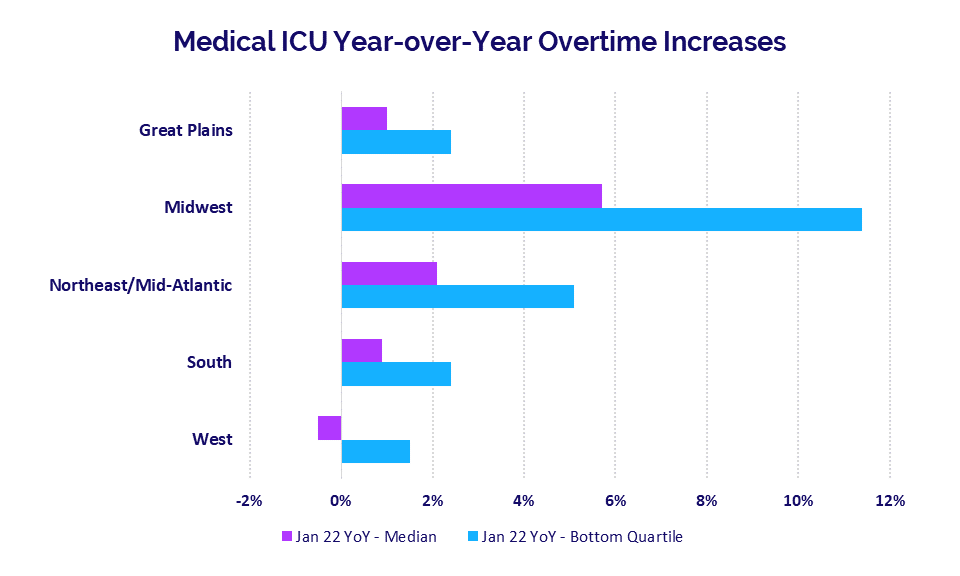
Hospitals increased overtime for medical ICU personnel to keep up with the rise in demand. Hospitals in the Midwest had the biggest increase in median Medical ICU Overtime at 5.7% from January 2021 to January 2022, followed by hospitals in the Northeast/Mid-Atlantic at 2.1% over the same period.
Year-over-year Medical ICU Overtime increases for the worst-hit hospitals in the bottom quartile ranged from a low of 1.5% for hospitals in the West to a high of 11.4% for hospitals in the Midwest.
Surgery volumes drop with renewed mitigations
Surgery volumes slumped in January as providers delayed elective procedures in efforts to reduce spread of the Omicron variant and to reserve hospital capacity and resources to treat more acute patients, including those with severe cases of COVID-19.
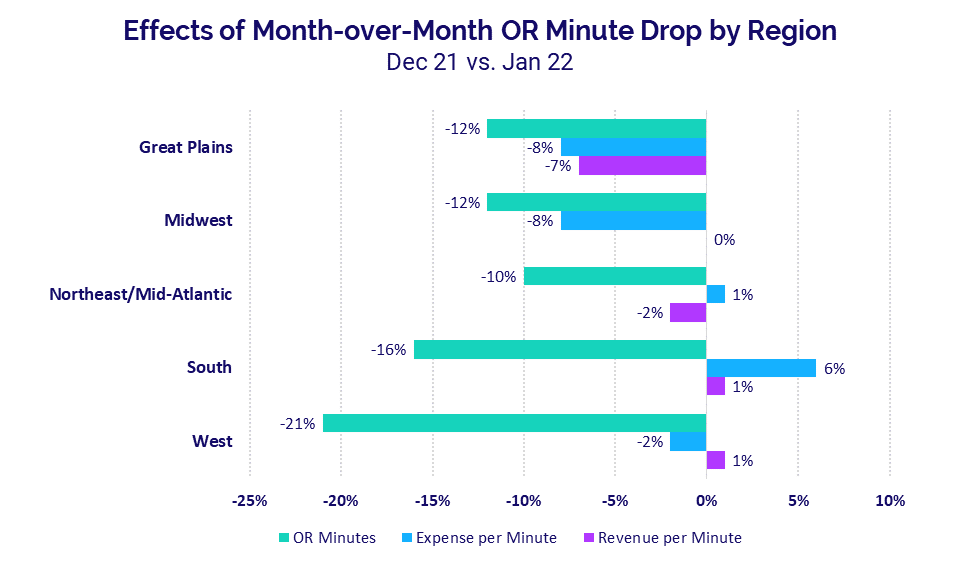
The West had the biggest decrease with Operating Room Minutes dropping -21% from December to January. Hospitals in the South had the second largest drop at -16%, followed by the Midwest and Great Plains, which both saw Operating Room Minutes decrease -12% month-over-month. The decreases contributed to increases in Expense per Minute in the South and Northeast/Mid-Atlantic, while providers in the Great Plains, Midwest, and West were able to control operating room expenses.
Hospital KPIs
February 2022
Hospitals took a big hit in January as Omicron ravaged organizations nationwide. Operating Margins plummeted while both labor and non-labor expenses continued to increase with widespread workforce shortages and global supply chain issues.
A sharp drop in outpatient care pushed down Adjusted Discharges. While the Omicron variant generally produces milder symptoms for a majority of those infected, exponential increases in the overall number of people infected also meant a proportional increase in patients with severe COVID-19 symptoms. As a result, hospitals saw a significant increase in more acute patients requiring longer hospital stays.
January 2022 financial KPIs for U.S. hospitals and health systems compared to January 2020 include:
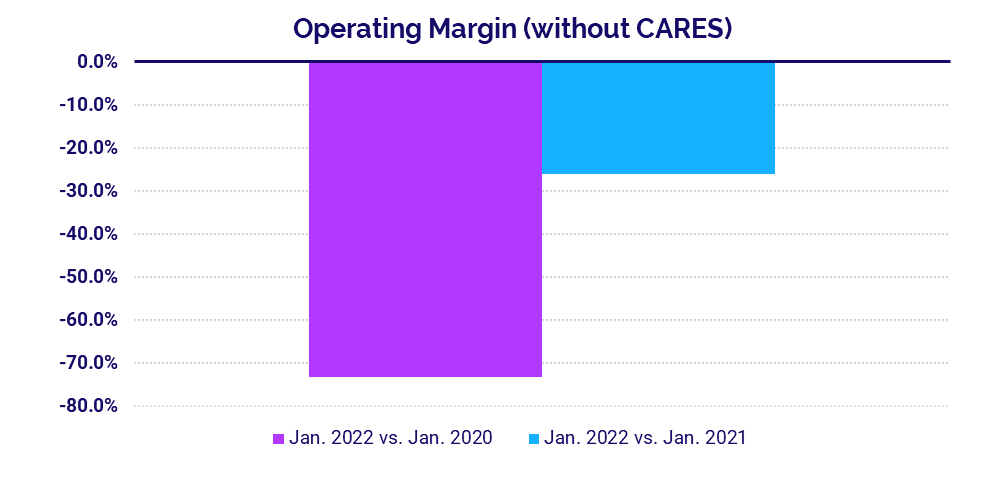
- Operating Margin (without CARES): -73.3%
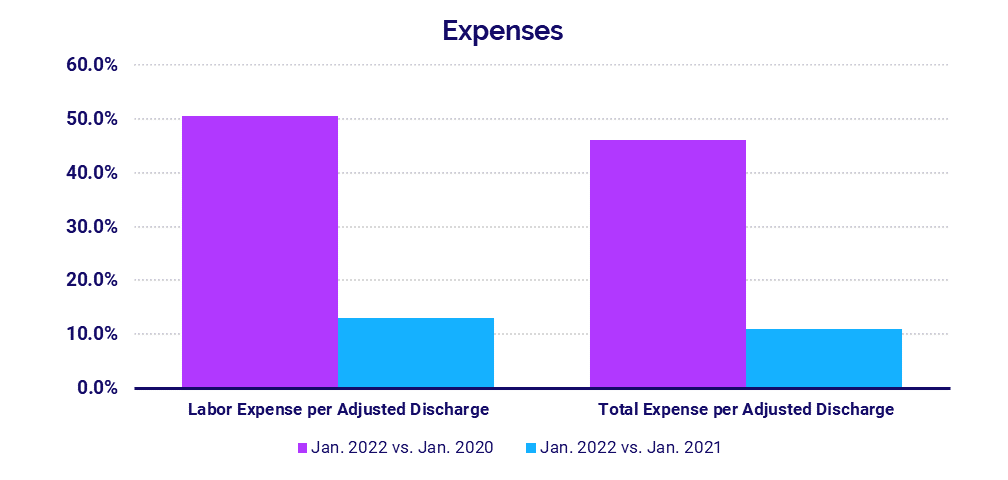
- Labor Expense per Adjusted Discharge: +50.6%
- Total Expense per Adjusted Discharge: +46.2%
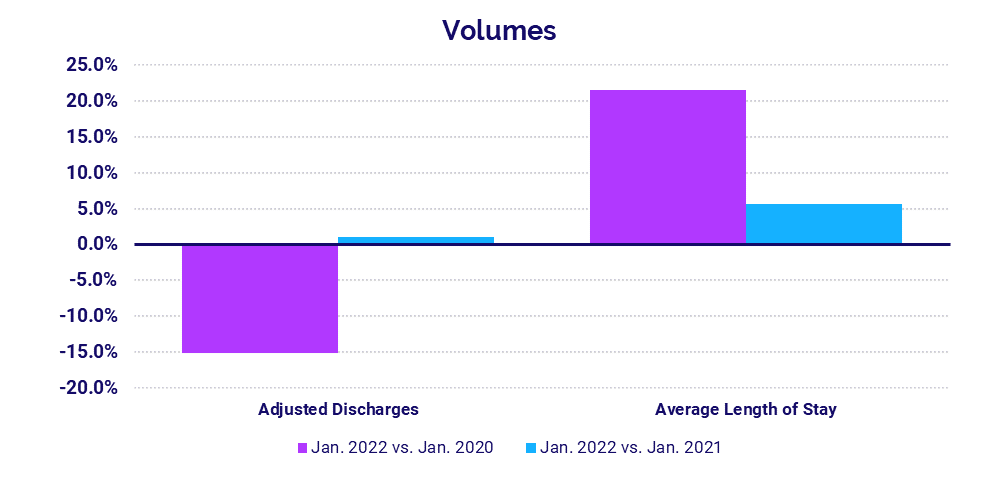
- Adjusted Discharges: -15.1%
- Average Length of Stay: +21.5%
Operating margins plummet
The spike in COVID-19 cases spurred by Omicron drove a -73.3% drop in the median hospital Operating Margin in January 2022 versus January 2020, not including federal Coronavirus Aid, Relief, and Economic Security (CARES) aid. Compared to January 2021, the median Operating Margin was down -26.2%.
Even with CARES aid, Operating Margin plunged -69% compared to January 2020, and was down -29.4% from January of last year.
Operating Earnings Before Interest, Taxes, Depreciation, and Amortization (EBITDA) Margin fell -51.8% from January 2020 and -21.5% from January 2021, without CARES. With the funding, Operating EBITDA Margin was down -49.4% from January 2020 and -24.2% from the first month of 2021. Hospitals in the Great Plains, West, Midwest, and South all saw year-over-year decreases in Operating EBITDA Margin (without CARES) in January.
Labor expenses continue to climb
Labor Expense per Adjusted Discharge jumped 50.6% versus January 2020 and was up 13% versus the same month last year as hospitals grappled with nationwide workforce shortages. At the same time, Full-Time Equivalents (FTEs) per Adjusted Occupied Bed (AOB) decreased -4.6% versus January 2021. The staffing level declines suggest that wages are a major driver of rising labor costs.
Hospitals in the West and Midwest had the biggest year-over-year increases in Labor Expense per Adjusted Discharge at 20.3% and 19.4%, respectively.
Total Expense per Adjusted Discharge rose 46.2% versus January 2020 and 11% compared to January 2021. Non-Labor Expense per Adjusted Discharge was 40.4% above January 2020 levels and 8.2% above January 2021 as hospitals continued to feel the repercussions of inflation exacerbated by global supply chain issues.
Omicron drives volatility in hospital volumes
Hospitals experienced decreases in outpatient volumes, but increases in more acute patients requiring longer hospital stays as Omicron cases surged across the country. Adjusted Discharges were down -15.1% compared to before the pandemic in January 2020 and essentially flat with an increase of just 0.2% compared to January 2021.
Meanwhile, the median Average Length of Stay (LOS) jumped 21.5% compared to January 2020 and was up 5.6% versus January 2021—reflecting the rise in sicker patients requiring longer hospital stays. Average LOS increased for hospitals in all regions, but the Midwest had the biggest year-over-year jump at 12%.
Emergency Department Visits declined -7.1% versus January 2020, but were up significantly from January 2021 levels with an increase of 18.8%.
Revenues outpace 2020 and 2021 performance
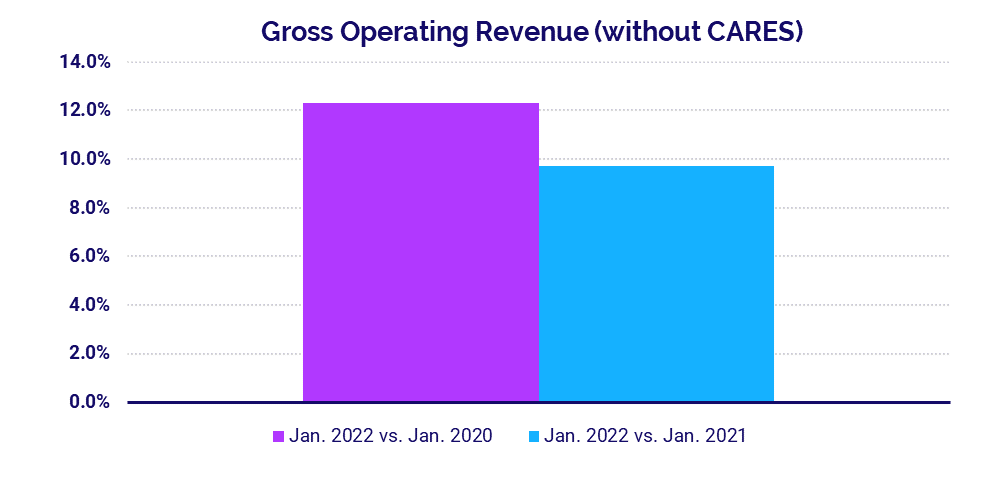
Hospital revenues continued to perform well. Gross Operating Revenue (without CARES) increased 12.3% versus the first month of 2020 and was up 9.7% compared to January 2021. Much of that increase can be attributed to higher revenues from inpatient care.
Inpatient (IP) Revenue rose 24.2% from January 2020 and 7.2% from January 2021. Outpatient Revenue was up 9.4% from pre-pandemic levels and up 10.8% versus January 2021.
Looking at revenues by region, Net Patient Service Revenue (NPSR) per Adjusted Discharge was up year-over-year and above budget for hospitals in all regions in January. The Great Plains had the biggest year-over-year increase at 12.1%, followed by the Midwest at 11.3%.
Physician Practice KPIs
February 2022
Annual physician data from the past two years shows stark differences between performance results in the first and second years of the COVID-19 pandemic. Physician practices nationwide experienced sizable expense increases in 2021 as they, too, felt the effects of widespread workforce shortages. Staffing levels decreased for practices across most specialties as a result.
Overall physician productivity increased as COVID-19 concerns eased, patients became less reluctant to visit physician offices, and physicians compensated for lower staffing levels. The higher productivity contributed to an increase in physician practice revenues and a corresponding decrease in physician investments.
The top five physician financial and operational KPIs from 2021 versus 2020 are:
- Total Direct Expense: +9.7%
- Support Staff Levels: -8.2%
- Productivity: +18.2%
- Revenue: +15.8%
- Investment: -3.6%
Physician expenses surpass pre-pandemic levels
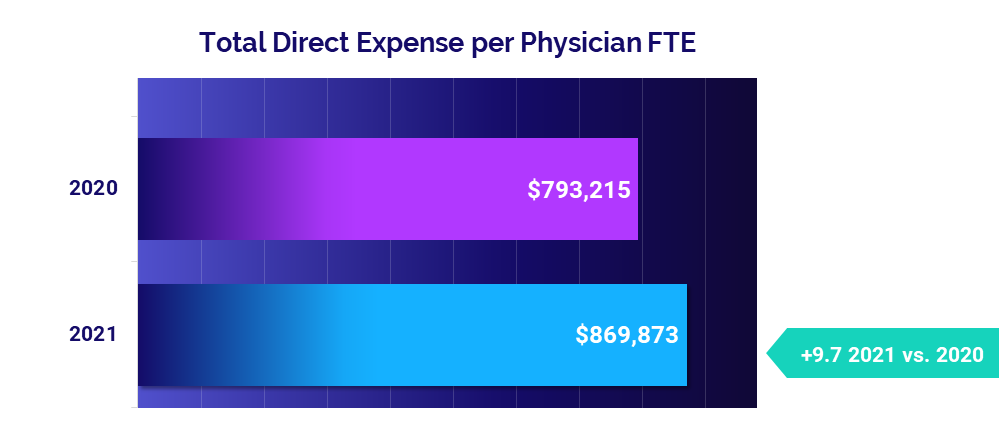
Physician expenses increased in 2021 as physician practices dealt with many of the same cost pressures affecting hospitals and other healthcare providers. The median Total Direct Expense per Physician FTE (including advanced practice providers) was $869,873 in 2021, up 9.7% from a median of $793,215 in 2020.
Expenses were up across all specialties. Medical Specialties had the largest increase at 12.8% from 2020 to 2021, followed by Hospital-based Specialties at 10% over the same period.
Physician expenses also rose year-over-year across all regions. Physician practices in the West had the biggest increase in Total Direct Expense per Physician FTE at 12.4%, followed by practices in the South at 10.5%. The Northeast/Mid-Atlantic had the least increase at 4.3%.
Physician practices reduce staffing levels
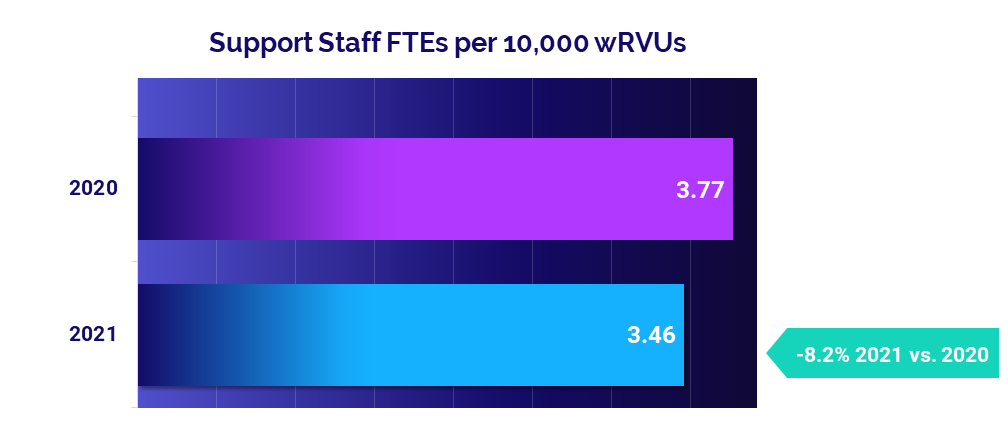
Staffing levels, as measured by Support Staff FTEs per 10,000 work Relative Value Units (wRVUs), decreased -8.2% year-over-year, from a median of 3.77 in 2020 to 3.46 in 2021. Contributing factors likely included mounting workforce shortages over the course of the year, rising expenses, and staffing reductions spurred by unstable patient volumes during the second year of the pandemic.
Primary Care had the biggest drop compared to other specialties, with Support Staff FTEs per 10,000 wRVUs down -8.5% year-over-year. Medical Specialties had the second largest decrease at -5.2% over the same period, while Surgical Specialties were down -4.6%.
Physician productivity picks up
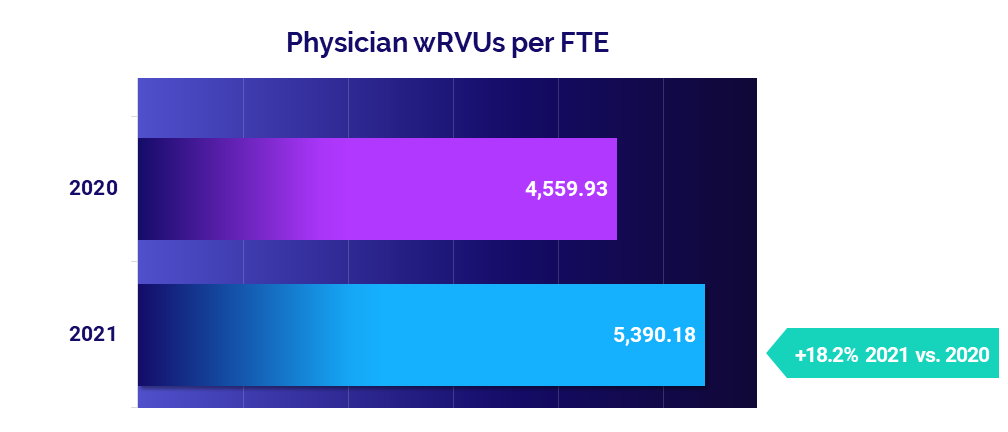
Overall physician productivity increased from 2020 to 2021 as patients became less reluctant to visit physician offices compared to the first year of the pandemic and as physicians compensated for reduced staffing levels. Median Physician wRVUs per FTE jumped 18.2% from 2020 to 2021.
Looking at different specialties, Medical Specialties and Primary Care had the biggest increases in median Physician wRVUs per FTE at 19.6% and 19.5%, respectively. Obstetrics and Gynecology had the least increase in productivity at 6.3%.
Physician revenues rise with greater productivity
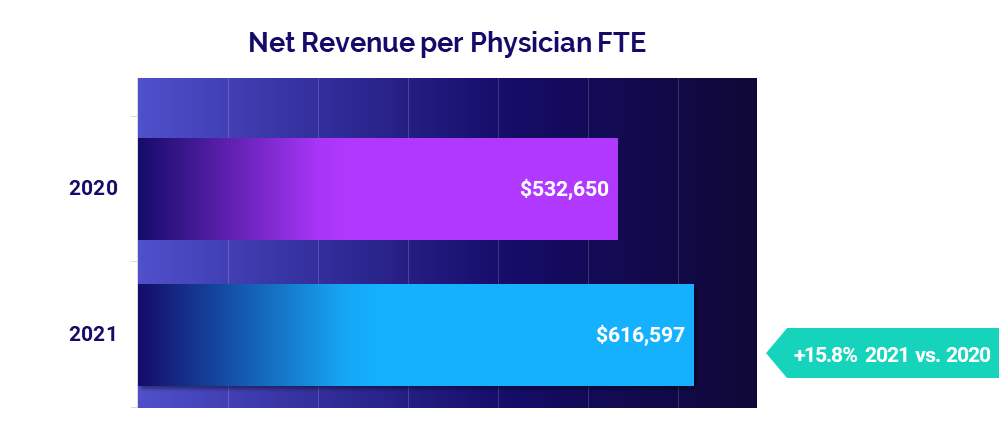
Physician revenues jumped 15.8% from 2020 to 2021. The median Net Revenue per Physician FTE (including advanced practice providers) rose from $532,650 in 2020 to $616,597 last year. By specialty, Surgical Specialties had the biggest year-over-year increase in Net Revenue per Physician FTE at 16.2%, while Hospital-based Specialties had the lowest increase at 7.3%.
Revenues rose year-over-year for physicians in all regions. Practices in the West had the highest increase in Net Revenue per Physician FTE at 18.4%, followed closely by the Midwest with an increase of 18% over the same period.
Physician investments show declines
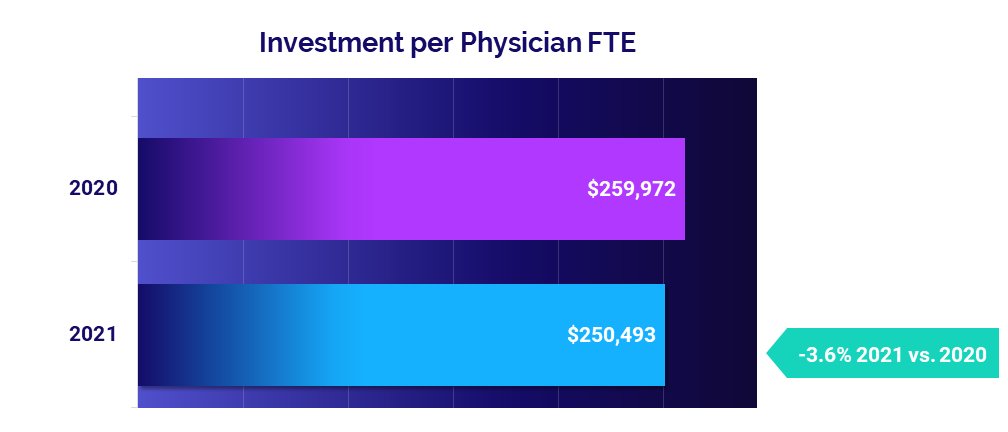
The level of investment needed to support physician practices decreased in 2021, due in part to higher physician revenues and productivity. The median Investment per Physician FTE was $250,493 in 2021, down -3.6% compared to a median of $259,972 in 2020. By specialty, Primary Care had the biggest decrease in Investment per Physician FTE at -15.9% year-over-year, while Hospital-based Specialties had the biggest increase at 5.3%.
Physician practices in the Midwest had the biggest year-over-year decrease, with Investment per Physician FTE falling -22.4% from 2020 to 2021. Practices in the Northeast/Mid-Atlantic and Great Plains also had decreases, while those in the South were essentially flat. The West was the only region to see a sizable increase for the metric, which rose 7.8% from 2020 to 2021.
The Road Ahead for Healthcare
The January performance results presented in this issue illustrate how the ongoing volatility of the pandemic continues to rock the healthcare industry. The ravages of the Omicron surge were devastating and vast. While COVID-19 cases continue to fall this month following the peak in mid-January, hospitals, health systems, and other providers are still reeling from the blow.
Recovery efforts will be long and arduous. Relentless and widespread workforce shortages and global supply chain issues pose additional roadblocks that will further complicate those efforts. Healthcare leaders will need to be vigilant, steadfast, and agile in the months and years ahead as they work to steer their organizations toward long-term financial and operational stability.
Having reliable data and analytics capabilities will be critical to success. Organizations need the ability to track KPIs in real time to identify opportunities for improvement and drive informed decision-making as they navigate an ever-turbulent healthcare environment.
Source: Syntellis’ Axiom™ Comparative Analytics, which offers access to real-time data drawn from more than 135,000 physicians from over 10,000 practices and 139 specialty categories, and from 500+ unique departments across more than 1,000 hospitals. Powered by Syntellis IQ, Comparative Analytics also provides data and comparisons specific to a single organization for visibility into how their market is evolving.
Regional data is broken down by state. The Northeast/Mid-Atlantic includes ME, VT, NH, MA, RI, CT, NY, PA, NJ, DE, MD, WV, and VA. The South includes FL, TX, LA, MS, AL, GA, SC, NC, OK, AR, TN, and KY. The Midwest includes WI, MI, IL, IN, and OH. The Great Plains includes ND, SD, NE, KS, MN, IA, and MO. The West includes CA, AZ, NM, NV, UT, CO, OR, ID, WY, WA, MT, AK, and HI.
1Centers for Disease Control and Prevention: COVID Data Tracker “Trends in Number of COVID-19 Cases and Deaths in the U.S. Reported to CDC, by State/Territory.” Accessed Feb. 24, 2022.
2CDC: “United States COVID-19 Cases and Deaths by State Over Time.” Accessed Feb. 20, 2022.

