Executive Summary:
Healthcare Providers Feel Lingering Impacts of Omicron
February proved to be another challenging month for healthcare providers nationwide. A record-high spike in COVID-19 cases from the highly contagious Omicron variant rapidly subsided in the second half of January and throughout February, causing reverberations industry-wide. The 7-day moving average of new COVID-19 cases dropped 92% from a peak of 809,628 in mid-January to 66,192 by the end of February, according to the Centers for Disease Control and Prevention (CDC).1
Urgent care and emergency department visits dropped abruptly in February in line with overall COVID-19 case trends, as fewer people sought care or testing for symptoms of the virus. At the same time, patients with severe COVID-19 infections required ongoing care, driving high demand in the nation’s intensive care units (ICUs).
Hospital revenue growth failed to keep pace with rising expenses, leading to unsustainable margin performance across key departments. Pay rates for contract nurses remained elevated in the wake of the surge due to intense competition for workers amid a tight labor market. Overall hospital margins fell below 2021 and 2020 performance as U.S. workforce shortages continued to drive up labor expenses and inflation exacerbated by global supply chain challenges led to higher non-labor costs. Lower volumes slowed hospital revenue growth in February, particularly for inpatient care.
For physicians, the level of investment needed to support practices rose above 2020 and 2021 levels. Physician expenses also increased versus 2021 and 2020 levels while physician revenues staggered. Physician productivity showed only moderate gains, and staffing levels remained low.
Read this month’s report for these and other trends in hospital and physician performance drawn from Syntellis’ analysis of data from more than 135,000 physicians and 1,000 hospitals. Key year-over-year findings include:
- Contract RNs Hourly Rate jumped +130.4%
- Urgent Care Visits increased +25%
- Medical ICU Patient Days rose +5%
- Hospital Operating Margins decreased -26.7%
- Median Physician Investment rose +23.3%
Steve Wasson
EVP and GM, Data and Intelligence Solutions
Syntellis Performance Solutions
Market Analysis
March 2022
February was a challenging month for healthcare providers nationwide as January’s record-high spike in COVID-19 cases from the highly contagious Omicron variant rapidly subsided, causing a wave of reverberations across the industry. The 7-day moving average of new COVID-19 cases dropped 92% from a peak of 809,628 in mid-January to 66,192 by the end of February, according to the CDC.
Contract nursing pay remained high in the wake of the Omicron surge, which drove up labor costs amid ongoing U.S. workforce shortages. Urgent care and emergency department visits continued to track similar trends as overall COVID-19 cases, with growth in both metrics dropping abruptly in February as fewer people sought care and testing for COVID-19 related symptoms. Meanwhile, patients suffering more severe infections from the virus required ongoing care, driving high demand in the nation’s ICUs.
High costs and unstable volumes contributed to unsustainable margin performance across key departments — such as Medical ICUs, Cath Labs, and Medical Surgical units — as hospital revenue growth failed to keep pace with rising expenses.
Key year-over-year February market analysis metrics include:
- Contract RNs Hourly Rate +130.4%
- Urgent Care Visits +25%
- Emergency Department Visits +9%
- Medical ICU Patient Days +5%
- Medical ICU Expense vs. Revenue per Unit of Service gap = 10 percentage points
Contract Nursing Pay Remains Elevated
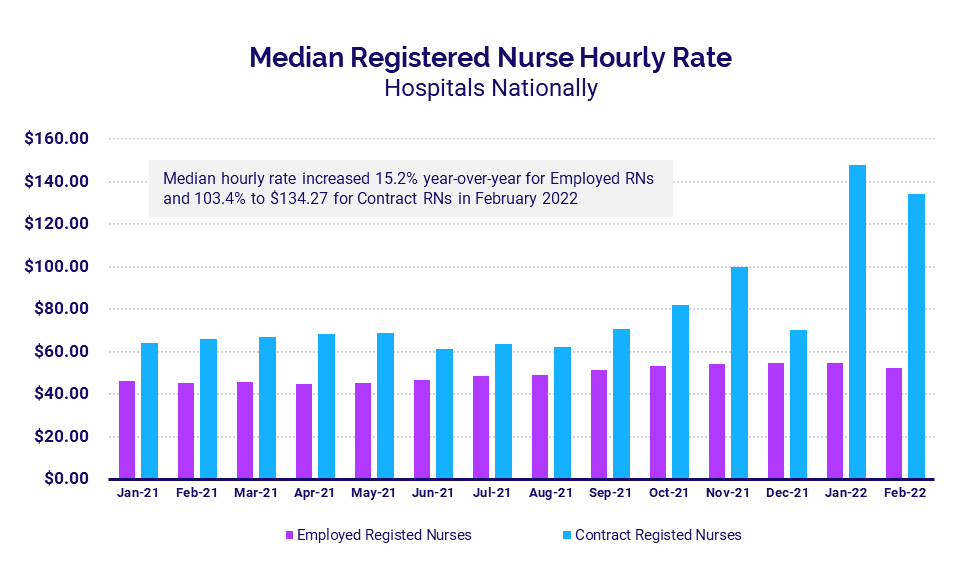
Nationwide workforce shortages continued to drive up hourly contract nursing pay for U.S. hospitals and health systems in the wake of intense demands from January’s Omicron surge. The median hourly rate for contract registered nurses (RNs) reached $134.27 per hour in February, up 103.4% year-over-year but down 9.4% from a peak of $148.20 the month before.
Pay for employed RNs remained much lower. The median hourly rate for employed RNs rose 15.2% year-over-year to $52.50 in February. That was down 4.5% from $54.97 in January, and more than 2.5 times less than the median rate for contract nurses.
Urgent Care, ER Visits Drop with End of Surge
Year-over-year growth in urgent care and emergency department (ED) volumes both dropped in February, following similar patterns as pandemic trends as fewer people sought COVID-19 testing or care for Omicron related symptoms.
Urgent care visits were up 25% compared to February 2021 levels, reflecting a 58 percentage-point drop after January’s spike of 83% above February 2021 levels. ED Visits followed a similar pattern, dropping to 9% above February 2021 levels — down 24 percentage points from 33% above February 2021 levels in January. At the same time, total COVID-19 cases dropped to about 3.7 million cases, down from a high of more than 20 million in January.
ICU Volume, Overtime Demands Persist
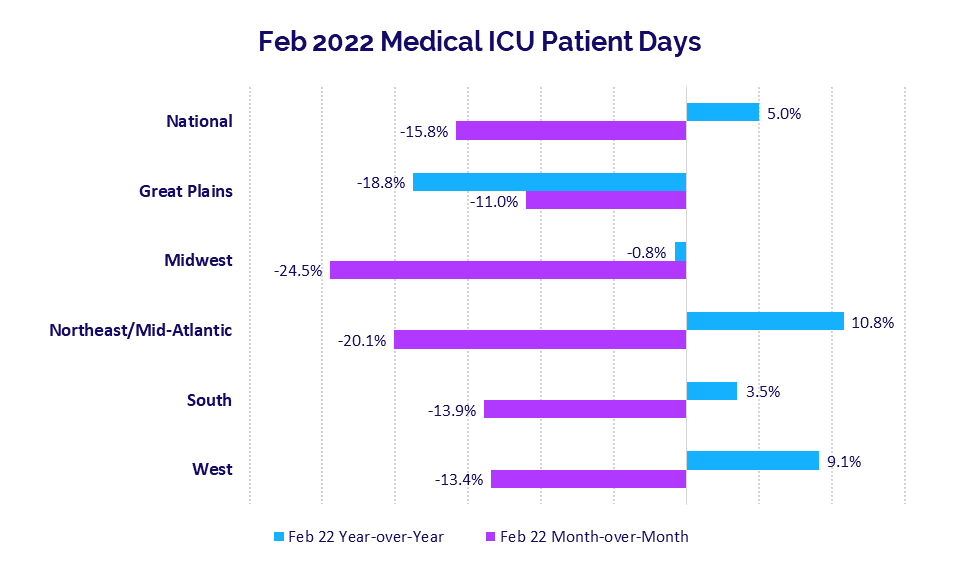
ICU demand remained high in February as patients with severe symptoms infected during the Omicron surge required ongoing care. Median Medical ICU Patient Days rose 5% year-over-year for hospitals nationwide, but were down -15.8% compared to January levels.
Hospitals in the Northeast/Mid-Atlantic had the largest year-over-year increase at 10.8% versus February 2021, but were down -20.1% compared to January’s highs. Hospitals in the Midwest had the biggest drop compared to January, with median Medical ICU Patient Days down -24.5% month-over-month. Year-over-year, Midwest hospitals were down -0.8% for the metric.
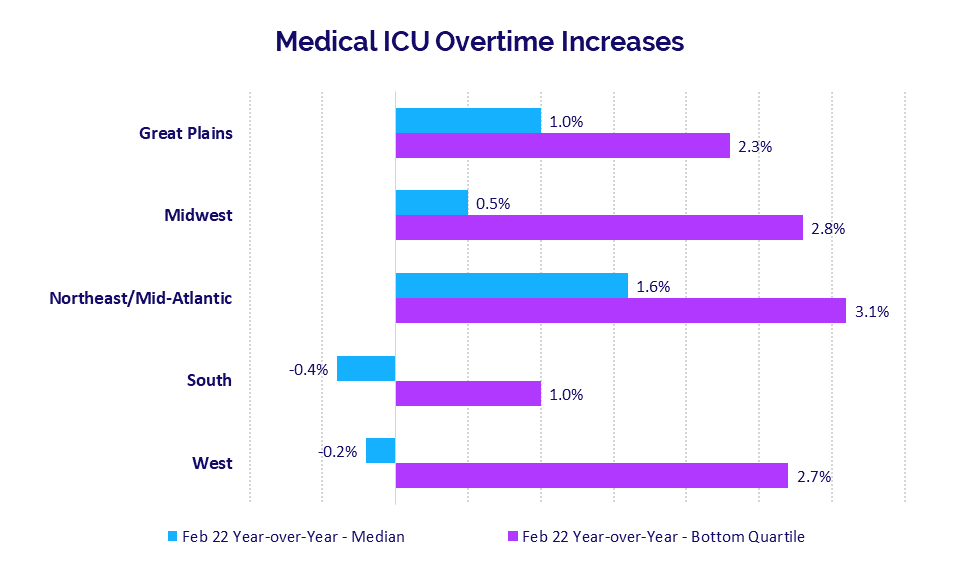
Year-over-year Medical ICU Overtime increases also remained high for hospitals in many areas of the country due to lingering demand in the aftermath of Omicron. Hospitals in the Northeast/Mid-Atlantic had the largest year-over-year increase in median Medical ICU Overtime at 1.6% from February 2021 to February 2022, followed by the Great Plains at 1% over the same period.
Year-over-year Medical ICU Overtime increases for the worst-hit hospitals in the bottom quartile ranged from a low of 1% for hospitals in the South to a high of 3.1% for hospitals in the Northeast/Mid-Atlantic. Looking over a 12-month period nationwide, the median Medical ICU Overtime was up just 0.4% for February 2021-February 2022 versus February 2020-February 2021.
Rising Expenses Outpace Revenues
Rising expenses outpaced revenue growth in February as the pandemic continues to drive volatility for healthcare providers across the country. Core departments have endured multiple months of disproportionate expense growth relative to revenues. The broadening gap reflects unsustainable margin conditions heading into the third year of the COVID-19 pandemic.
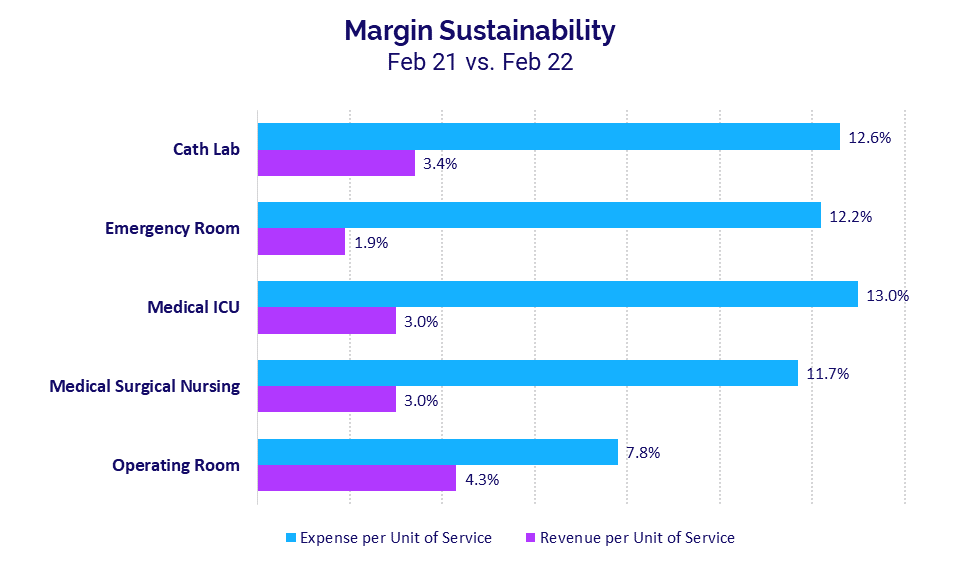
Not surprisingly, Medical ICUs had among the biggest divides in February, with Expense per Unit of Service up 13% year-over-year compared to a 3% increase in Revenue per Unit of Service over the same period. Cath Labs had the second highest expense increase, with Expense per Unit of Service jumping 12.6% versus a 3.4% increase in Revenue per Unit of Service.
For Cath Labs, February marked the tenth consecutive month in which expense growth outpaced revenue growth. Operating Rooms had a sixth consecutive month in disproportionate growth in expenses versus revenues, while Medical ICUs and Medical Surgical Nursing units each had four consecutive months of disproportionate increases.
Hospital KPIs
March 2022
U.S. hospitals and health systems continued to struggle in February as the ripple effects of Omicron lingered, causing ongoing margin pressures. Both median Operating Margin and median Operating Earnings Before Interest, Taxes, Depreciation, and Amortization (EBITDA) Margin fell below 2021 and 2020 performance as a result.
Nationwide workforce shortages drove up labor expenses, and inflation exacerbated by global supply chain challenges led to higher non-labor costs. Rapid declines in COVID-19 cases starting the second half of January and continuing throughout February marked the end of the Omicron surge, causing a drop in inpatient volumes. Meanwhile, there was an increase in more acute patients — including severe COVID-19 cases — requiring longer hospital stays. Lower overall volumes slowed hospital revenue growth in February, particularly for inpatient care.
February 2022 financial KPIs for U.S. hospitals and health systems compared to February 2020 include:
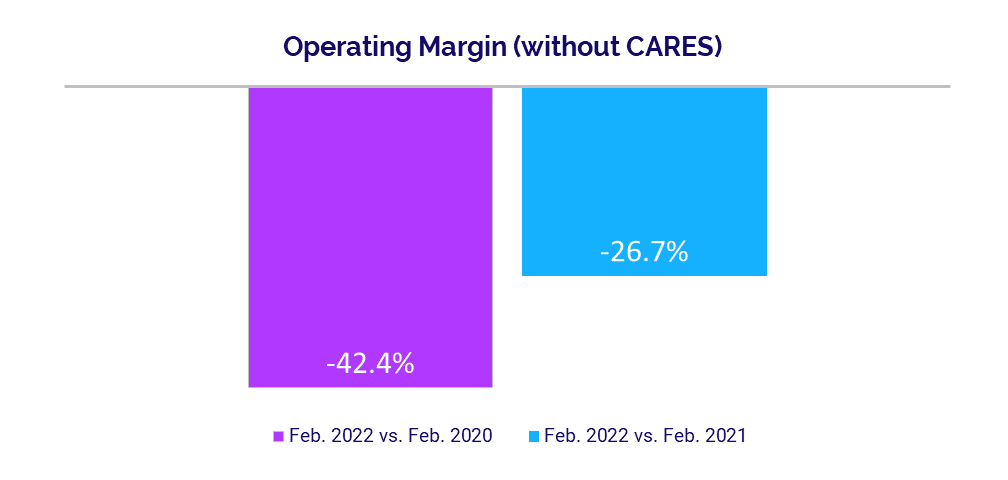
- Operating Margin (without CARES): -42.4%
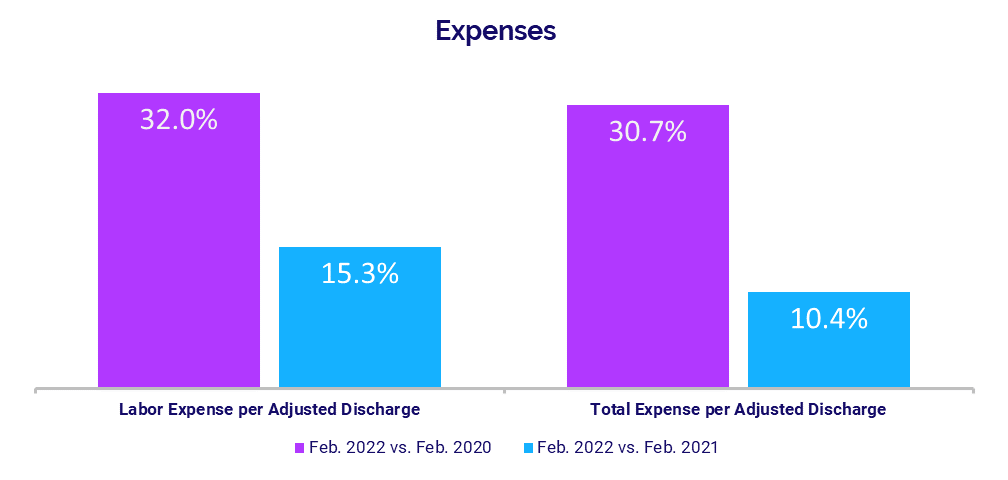
- Labor Expense per Adjusted Discharge: +32%
- Total Expense per Adjusted Discharge: +30.7%
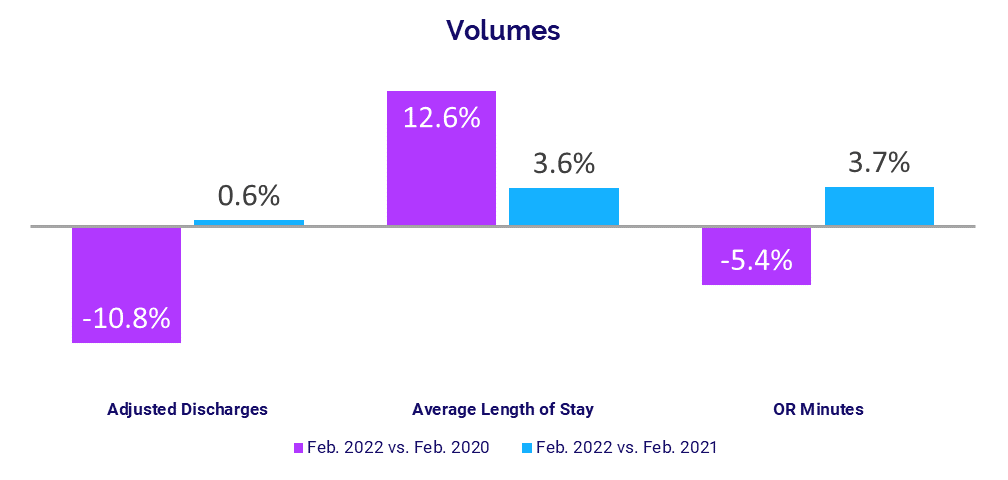
- Adjusted Discharges: -10.8%
- Gross Operating Revenue: +5.7%
Operating Margins Decline
The effects of the Omicron surge created ongoing margin pressures for U.S. hospitals and health systems in February. The median hospital Operating Margin was down -42.4% compared to just before the start of the pandemic in February 2020, and down -26.7% versus February 2021, not including federal Coronavirus Aid, Relief, and Economic Security (CARES) funding.2 With CARES, the median Operating Margin was down -40.2% compared to February 2020 and down -36% year-over-year.
Operating EBITDA Margin decreased -37.5% versus February 2020 and -24.3% year-over-year, without CARES. With CARES, the metric was down -36.3% versus February 2020 and -31.9% compared to February 2021.
Hospitals in the Midwest had the most significant year-over-year drop in Operating EBITDA Margin (without CARES) at -41%. Hospitals in the Northeast/Mid-Atlantic, South, and Great Plains also had declines.
Labor Expenses Continue to Mount
Labor Expense per Adjusted Discharge continued an upward trajectory in February, rising 15.3% compared to February 2021 and 32% versus the same month in 2020. Hospitals in the Midwest and South had the biggest year-over-year increases in Labor Expense per Adjusted Discharge at 17.2% and 19.2%, respectively.
The increases came despite lower staffing levels nationwide, indicating wage pressures as a primary factor in rising expenses in today’s competitive staffing environment. Full-Time Equivalents (FTEs) per Adjusted Occupied Bed (AOB) declined -4.8% from February 2021 and were flat compared to the second month of 2020.
Total Expense per Adjusted Discharge increased 30.7% compared to before the start of the pandemic in February 2020 and 10.4% compared to February 2021. Inflation exacerbated by global supply chain challenges continued to drive up non-labor expenses. Non-Labor Expense per Adjusted Discharge was up 25.8% versus February 2020 and rose 8% year-over-year.
Volumes Stumble Following Omicron Surge
The rapid decline in COVID-19 cases marking the end of the Omicron surge caused a drop in inpatient volumes versus pre-pandemic levels, while outpatient volumes failed to recover. Adjusted Discharges decreased -10.8% compared to pre-pandemic February 2020 levels. Patient Days and Adjusted Patient Days both decreased -4.7% over the same period.
Average Length of Stay (LOS) rose 12.6% above February 2020 and 3.6% compared to February 2021, reflecting increases in more acute patients requiring care for longer periods, including those suffering severe symptoms of COVID-19.
Operating Room Minutes remained down compared to before the pandemic, with a -5.4% decrease versus February 2020. Compared to February 2021, however, Operating Room Minutes increased 3.7%, Adjusted Patient Days rose 5.2%, Patient Days were up 3.9%, and Adjusted Discharges increased just 0.6%.
Revenue Growth Slows
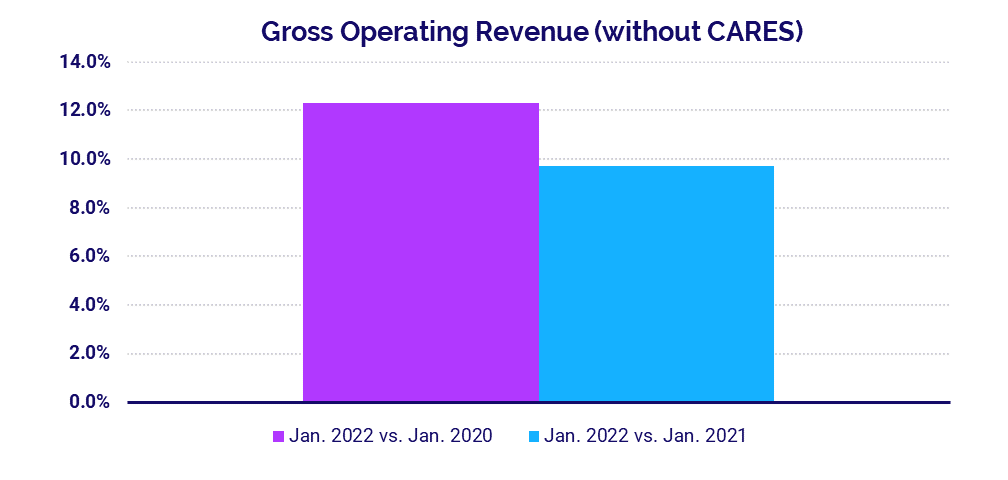
Lower volumes curbed hospital revenue growth in February. Gross Operating Revenue increased 7.8% year-over-year following a 9.7% year-over-year rise in January. Compared to February 2020, Gross Operating Revenue was up 5.7% following a 12.3% jump in January versus the first month of 2020.
Inpatient Revenue had minimal variations, rising just 0.9% versus February 2021 and down -1.2% compared to February 2020. Outpatient Revenue had a more significant year-over-year increase at 9.3%, but was down -2.8% compared to February 2020.
By region, Net Patient Service Revenue (NPSR) per Adjusted Discharge rose year-over-year and above budget for hospitals across all regions in February. The Great Plains had the biggest year-over-year increase at 7.6%, followed by the South at 5.7%.
Physician Practice KPIs
March 2022
As with other healthcare providers, the impacts of the Omicron surge created difficulties for physician practices in the first two months of 2022. The level of investment needed to support physician practices rose above both 2020 and 2021 levels as expenses increased and revenues staggered. Obstetrics and Gynecology (OB/GYN) had the largest increases in median Investment per Physician FTE compared to other specialty groups.
Physician expenses also rose above 2021 and 2020 levels as physician practices continued to feel many of the same pressures as other healthcare providers, including higher supply costs and tight wage competition amid devastating workforce shortages. Physician revenues were essentially flat compared to 2021 levels, while physician productivity showed only moderate gains. Staffing levels remained low, up only slightly from 2021 and decreasing relative 2020.
The top five physician financial and operational KPIs from February (annualized) versus 2021 are:
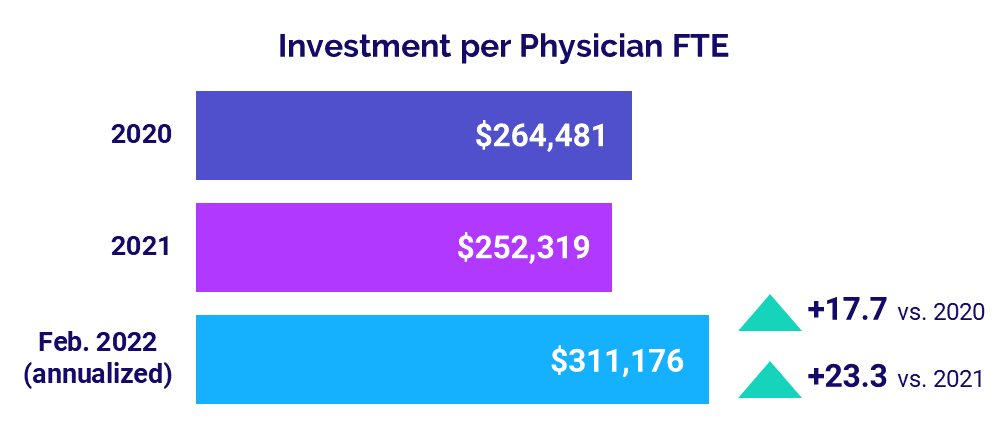
- Investment: +23.3%
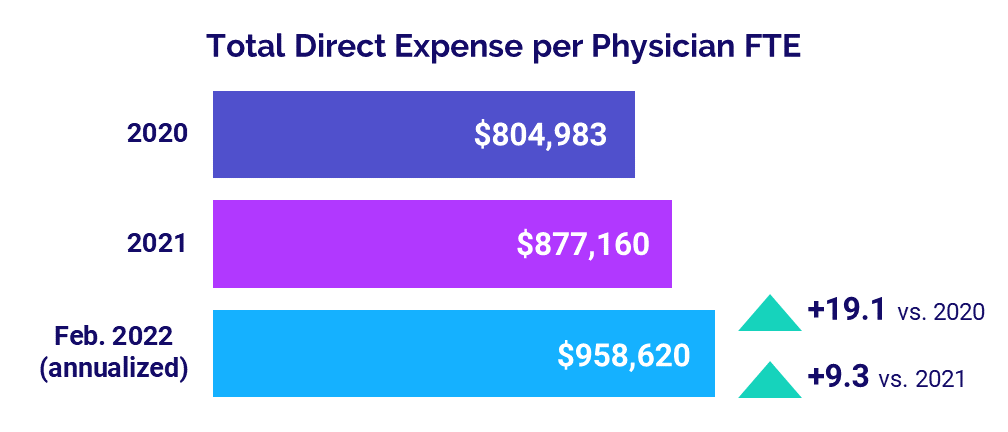
- Total Direct Expense: +9.3%
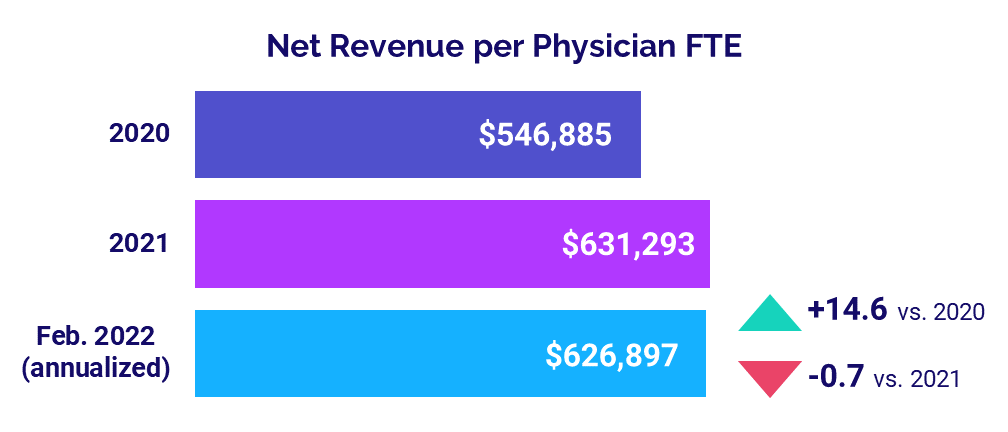
- Revenue: -0.7%
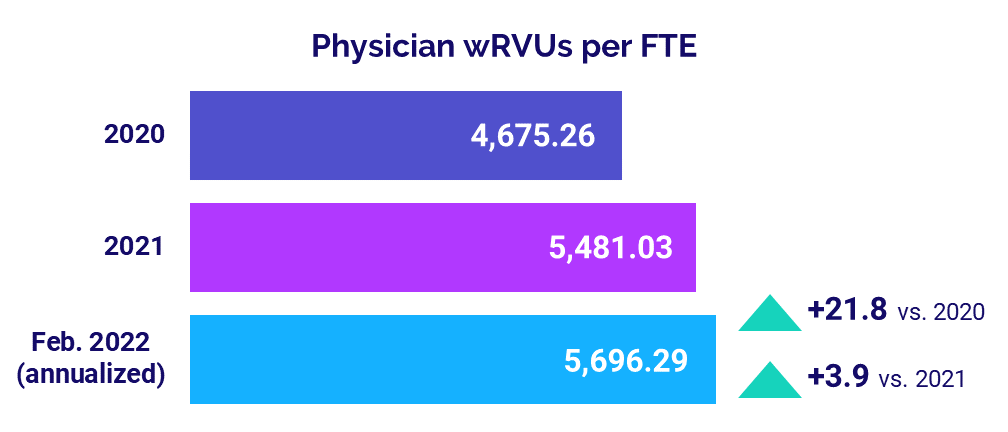
- Productivity: +3.9%
- Support Staff Levels: +1.3%
Physician Investments Increase
The level of investment needed to support physician practices increased with rising expenses and stagnant revenues for the first two months of 2022. The annualized median Investment per Physician FTE was $311,176 in February, up 23.3% compared to $252,319 in 2021 and up 17.7% versus $264,481 in 2020.
Investment per Physician FTE increased compared to 2020 and 2021 levels across all specialties. OB/GYN had the biggest increases by far at 38.9% versus 2021 and 41.6% compared to 2020. Primary Care had the second largest increase versus 2021 at 23.1%, while Surgical Specialties had the second highest increase from 2020 at 18.3%.
The median Investment per Physician FTE also increased for physician practices in all regions compared to both 2021 and 2020. The Midwest had the biggest increase versus 2021 at 39.5%, followed closely by the Northeast/Mid-Atlantic at 39.2%. The West had the largest increase compared to pre-pandemic levels, with Investment per Physician FTE up 29.1% compared to 2020 performance.
Physician Expenses Continue to Climb
Physician expenses rose above 2021 and 2020 levels in February as physician practices continued to feel many of the same pressures as other healthcare providers, including higher supply costs and wage competition amid U.S. workforce shortages.
The annualized, median Total Direct Expense per Physician FTE (including advanced practice providers) was $958,620 in February. That was up 9.3% from 2021 and up 19.1% from 2020. Expenses rose across all specialties. Medical Specialties had the biggest increases, with the metric up 10.1% versus 2021 and more than double that, up 23.4% compared to 2020.
Physician expenses also rose year-over-year across all regions. Physician practices in the West had the largest increases, with February annualized Total Direct Expense per Physician FTE rising 16.7% versus 2021 and 31.2% compared to 2020.
Physician Revenues Idle
Physician revenues were essentially flat compared to 2021 levels, likely due to reduced patient volumes following the Omicron surge. The annualized median Net Revenue per Physician FTE (including advanced practice providers) was $626,897 in February, down slightly at -0.7% compared 2021. Compared to 2020, however, median Net Revenue per Physician FTE was up 14.6%.
Revenues decreased year-over-year for physician practices in four of five regions. Practices in the South had the biggest decrease at -4.2% versus 2021. Among different specialty cohorts, Net Revenue per Physician FTE decreased -6.3% year-over-year for Surgical Specialties, -1.9% year-over-year for Medical Specialties, and was flat year-over-year for OB/GYN.
Physician Productivity Rises
Physician productivity showed moderate gains for the first two months of 2022. Median Physician work Relative Value Units (wRVUs) per FTE rose to 5,696.29 annualized in February, up 3.9% from 2021 and up 21.8% compared to 2020.
Among different specialty cohorts, Hospital-based Specialties had the biggest increase in physician productivity compared to 2021, with Physician wRVUs per FTE up 9.9% year-over-year. Medical Specialties had the largest increase compared to 2020, with the metric jumping 26.5%.
Staffing Levels Remain Low
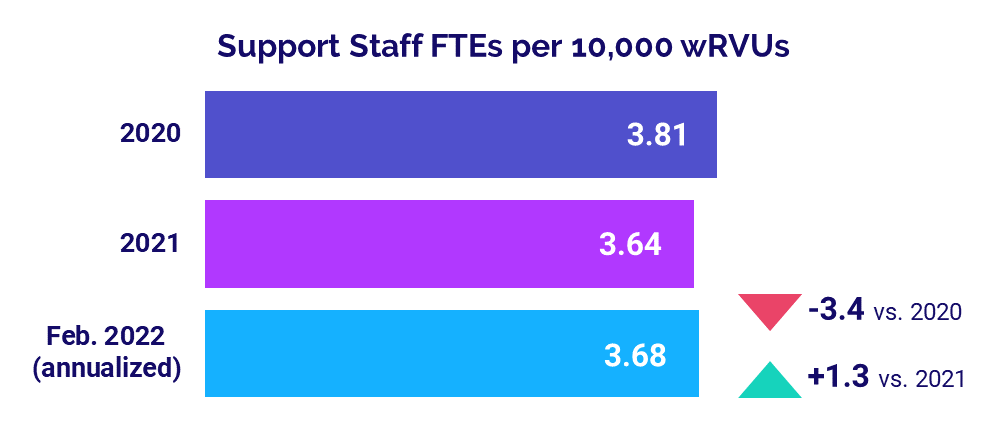
Staffing levels at physician practices nationwide — as measured by Support Staff FTEs per 10,000 work Relative Value Units (wRVUs) — increased to 3.68 in February (annualized), up just 1.3% versus 2021 levels. Compared to 2020, the metric was down -3.4%. U.S. workforce shortages and rising expenses likely contributed to continued low staffing relative to the first year of the pandemic.
Primary Care had the biggest drop in staffing levels compared to 2020. Support Staff FTEs per 10,000 wRVUs were down -10.2% versus 2020 and -0.5% versus 2021 for the specialty cohort. Surgical Specialties had the second largest decrease at -5.5% compared to 2020 staffing levels.
The Road Ahead for Healthcare
Healthcare providers had a rough start to 2022 as the Omicron surge drove COVID-19 cases to record-high levels. Both the sudden spike and the abrupt drop in cases in January and February have left hospitals, physician practices, and other healthcare providers reeling. Volumes remain unstable and expenses continue to rise at unsustainable rates due in part to nationwide workforce shortages.
Barring another pandemic surge, performance likely will stabilize somewhat in coming months, but the impacts of Omicron will reverberate throughout 2022. Healthcare leaders need reliable data and analytics capabilities to guide informed strategic decision-making and ensure long-term success as they work to build financial stability. Tracking KPIs in real time organization-wide is essential to pinpoint opportunities for improvement in today’s volatile healthcare environment.
Source: Syntellis’ Axiom™ Comparative Analytics, which offers access to real-time data drawn from more than 135,000 physicians from over 10,000 practices and 139 specialty categories, and from 500+ unique departments across more than 1,000 hospitals. Powered by Syntellis IQ, Comparative Analytics also provides data and comparisons specific to a single organization for visibility into how their market is evolving.
Regional data is broken down by state. The Northeast/Mid-Atlantic includes ME, VT, NH, MA, RI, CT, NY, PA, NJ, DE, MD, WV, and VA. The South includes FL, TX, LA, MS, AL, GA, SC, NC, OK, AR, TN, and KY. The Midwest includes WI, MI, IL, IN, and OH. The Great Plains includes ND, SD, NE, KS, MN, IA, and MO. The West includes CA, AZ, NM, NV, UT, CO, OR, ID, WY, WA, MT, AK, and HI.
1 Centers for Disease Control and Prevention: COVID Data Tracker, Trends in Number of COVID-19 Cases and Deaths in the U.S. Reported to the CDC, by State/Territory. Accessed March 23, 2022.
2 The lessening difference between margin performance with and without CARES reflects tapering off of funding in early 2022. Additional Phase 4 distributions in the first half of 2022 likely will increase variability again in the coming months.

