Executive Summary
Rising Costs Continue to Hit Healthcare Providers in April
U.S. healthcare providers continued to feel the strain of rising expenses in April, driven by a convergence of challenges including inflation, global supply chain issues, and nationwide workforce shortages. Those forces contribute to deepening margin sustainability issues, as growth in expenses far outpaces revenue increases.
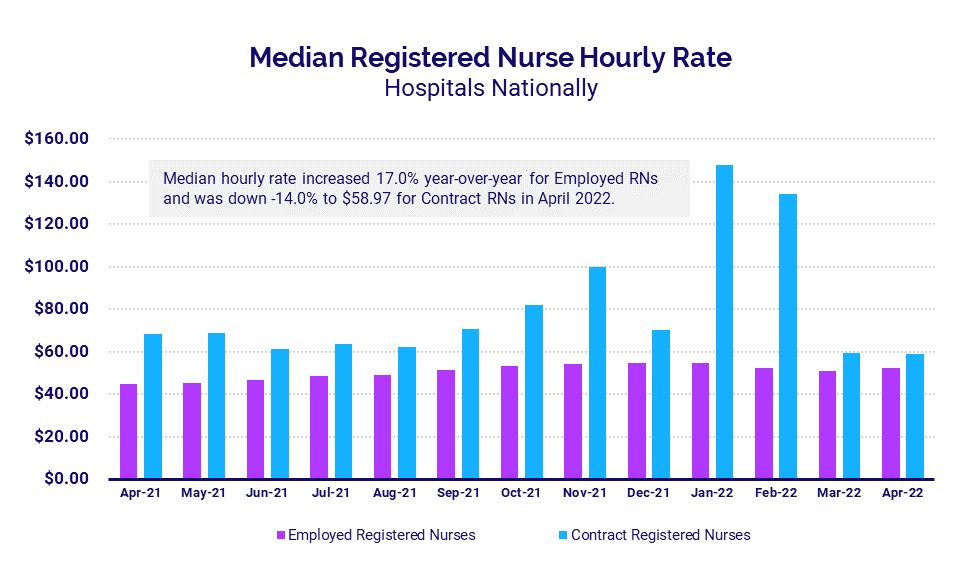
Meanwhile, a narrowing gap between hourly pay for employed and contract registered nurses (RNs) suggests a shift in hospitals’ approach to workforce shortages. Hourly pay rates for contract RNs has rapidly declined since February while pay for employed RNs has steadily increased, indicating a higher focus on recruitment and retention of employed labor over reliance on contracted labor.
Higher expenses and weak volumes contributed to year-over-year margin declines for the nation’s hospitals and health systems for a fourth consecutive month following the Omicron surge. Labor Expense per Adjusted Discharge continued to see the biggest year-over-year increases compared to other expense metrics due to the ongoing pressures of workforce shortages. Performance remained down across most key performance metrics compared to 2021 levels, but hospitals showed gains relative to lows seen in the early months of the pandemic in 2020.
For physicians, expense increases pushed the level of investment needed to support physician practices above 2020 and 2021 levels. Physician productivity also continued to rise, indicating an increase in patient demand three months after the Omicron surge.
Key year-over-year results include:
- Per-unit Emergency Department Expense vs. Revenue gap widened to +22.5 percentage points
- Employed RNs Hourly Rate increased +17.0%
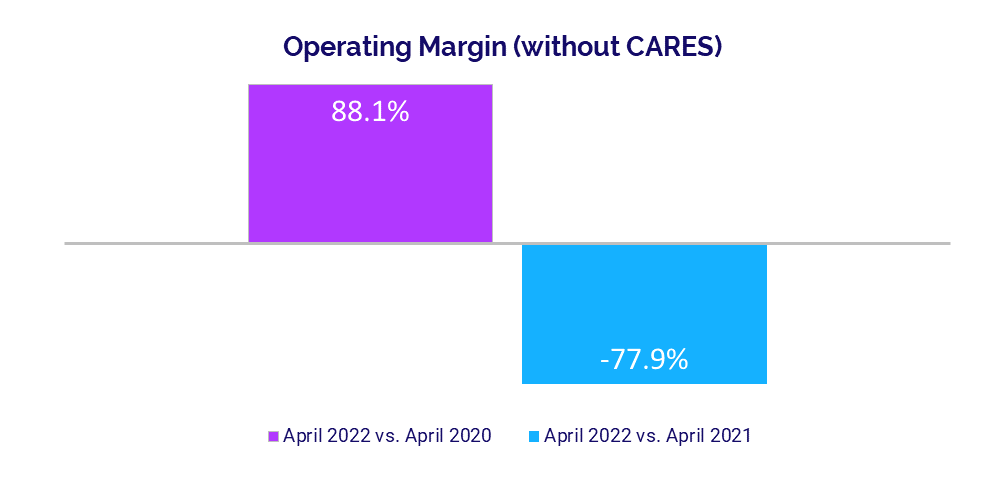
- Hospital Operating Margins decreased -77.9%
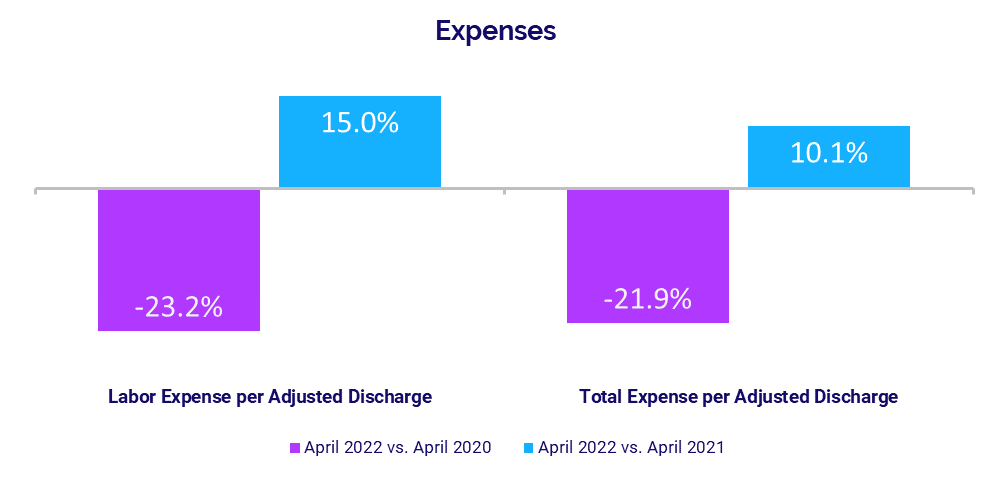
- Labor Expense per Adjusted Discharge rose +15.0%
- Median Physician Investment rose +18.4%
Steve Wasson
EVP and GM, Data and Intelligence Solutions
Syntellis Performance Solutions
Market Analysis
May 2022
U.S. healthcare providers continued to feel the strain of rising expenses and nationwide workforce shortages in April, deepening ongoing margin sustainability issues. At the same time, disparities in pay between employed and contract RNs eased following dramatic spikes in contract nursing pay from January’s Omicron surge.
Rapid declines in contract RN pay combined with progressive increases in employed RN pay suggest a shift in healthcare providers’ approach to nationwide workforce shortages, as they focus their efforts on recruitment and retention rather than reliance on contracted labor.
Hospitals continued to see widening gaps in year-over-year growth of per-unit expenses versus per-unit revenues for key departments. The trend reflects increasingly unsustainable margin conditions as healthcare providers contend with the pressures of nationwide workforce shortages, inflation, and supply chain issues. Urgent care and ED volumes increased year-over-year, but the pace of growth was down compared to the previous month despite an uptick in COVID-19 cases, reflecting the milder nature of the latest Omicron variant.
Key year-over-year April market analysis metrics include:
- Contract RNs Hourly Rate -14%
- Employed RNs Hourly Rate +17%
- ED Expense per Unit of Service +22.5%
- ED Revenue per Unit of Service 0%
- Urgent Care Visits +12%
Increased Pay for Employed RNs Suggests Strategy Shift
Disparities in pay between employed and contract RNs continued to ease in April following dramatic spikes in contract nursing pay in January and February driven by patient care labor demands during the Omicron surge. The median hourly rate for contract RNs was $58.97 in April, down -14% year-over-year. The median hourly rate for employed RNs was $52.60 for the month, up 17% compared to April 2021.
While the narrowing gap in pay for contract versus employed RNs indicates an easing in COVID-19 staffing demands, it also suggests a shift in healthcare providers’ approach to nationwide workforce shortages. Recruitment and retention are increasingly the focus as providers reduce pay for contracted labor in favor of raising rates for employed staff members.
Margin Sustainability Issues Endure
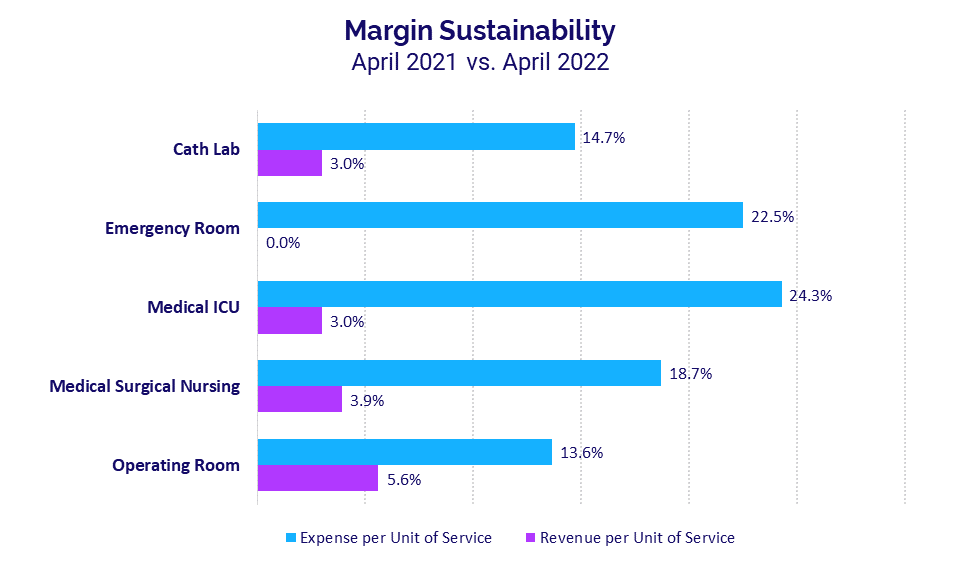
Hospitals continued to see wide variations in the year-over-year growth of per-unit expenses versus per-unit revenues for core departments in April. The trend reflects increasingly unsustainable margin conditions as healthcare providers contend with the pressures of nationwide workforce shortages, inflation, and supply chain issues.
EDs had the biggest divide, with Expense per Unit of Service up 22.5% year-over-year compared to zero growth in Revenue per Unit of Service for the month. The 22.5 percentage-point difference in the two metrics widened from a difference of 15.7 percentage points in March.
Medical Intensive Care Units (ICUs) had the second biggest gap in year-over-year growth, with Expense per Unit of Service up 24.3% in April compared to a 3% increase for Revenue per Unit of Service. The difference expanded to 21.3 percentage points for the month, up from 18.8 percentage points in March and 10 percentage points in February. April marked a sixth consecutive month of disproportionate increases in Medical ICU expenses versus revenues.
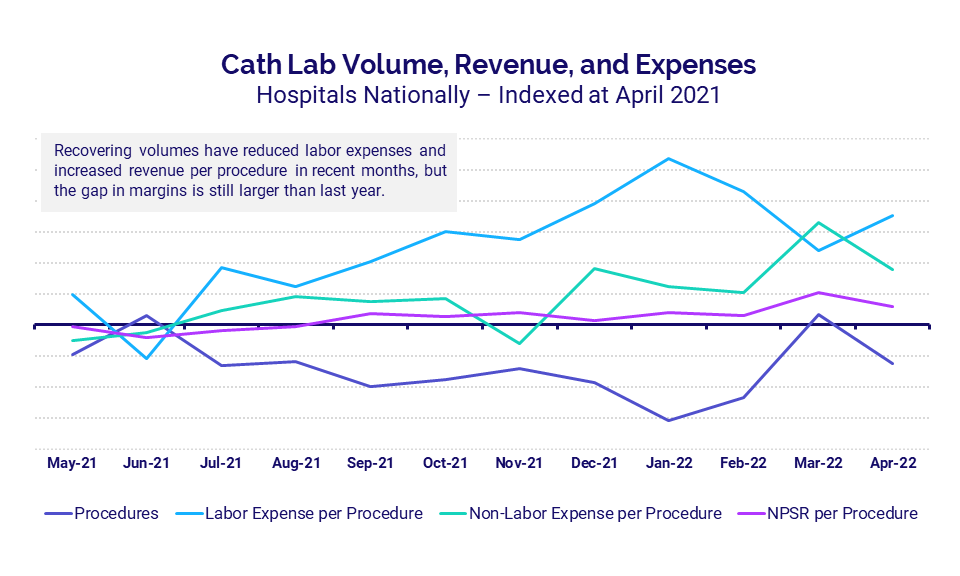
To further illustrate the gap between revenues and expenses, this graph shows trends in Cath Lab labor and non-labor expenses, revenues, and procedures using April 2021 levels as a baseline. The data show an inverse relationship between procedures and labor, with Labor Expense per Procedure increasing as actual Procedures decrease and vice versa. Revenues — measured as Net Patient Service Revenue (NPSR) per Procedure — recovered somewhat with more procedures in March and April compared to prior months, but disparities in revenues and expenses remain significantly higher than in 2021.
Urgent Care, ER Volumes Continue to Rise
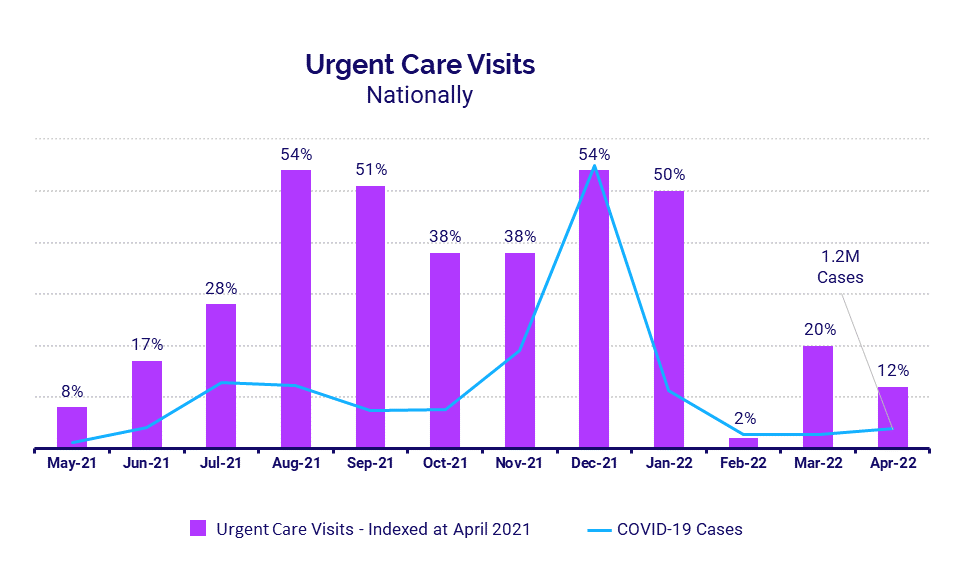
Volumes in the nation’s urgent care centers and EDs increased year-over-year in April, but the rate of increases was down compared to the previous month. Urgent Care Visits rose 12% year-over-year in April compared to a 20% year-over-year increase in March. ED Visits were up just 3% year-over-year versus a 9% year-over-year increase the month before.
The reduced rate of growth in ED and urgent care volumes came despite an uptick in total COVID-19 cases — which rose 27% from about 945,000 in March to 1.2 million in April — reflecting the milder nature of the most recent Omicron variant.
Hospital KPIs
May 2022
Hospitals and health systems nationwide continued to see mixed results in April, as expense increases persisted, volumes remained weak, and operating margins dropped year-over-year for a fourth consecutive month following the Omicron surge. While performance was down across most metrics compared to 2021 levels, hospitals showed gains relative to lows seen in the early months of the pandemic in 2020.
The median hospital Operating Margin decreased -77.9% year-over-year in April but was up 88.1% compared to April 2020, when hospitals saw volumes plummet with nationwide shutdowns and halting of nonurgent procedures. Per-patient expenses followed a similar pattern, with Total Expense, Labor Expense, and Non-Labor Expense per Adjusted Discharge all up versus April 2021 but down from the second month of the pandemic in 2020.
Labor continued to see the biggest year-over-year increases compared to other expense metrics due to the ongoing pressures of nationwide workforce shortages. April 2022 financial KPIs for U.S. hospitals and health systems compared to April 2021 include:
- Operating Margin (without CARES): -77.9%
- Labor Expense per Adjusted Discharge: +15%
- Total Expense per Adjusted Discharge: +10.1%
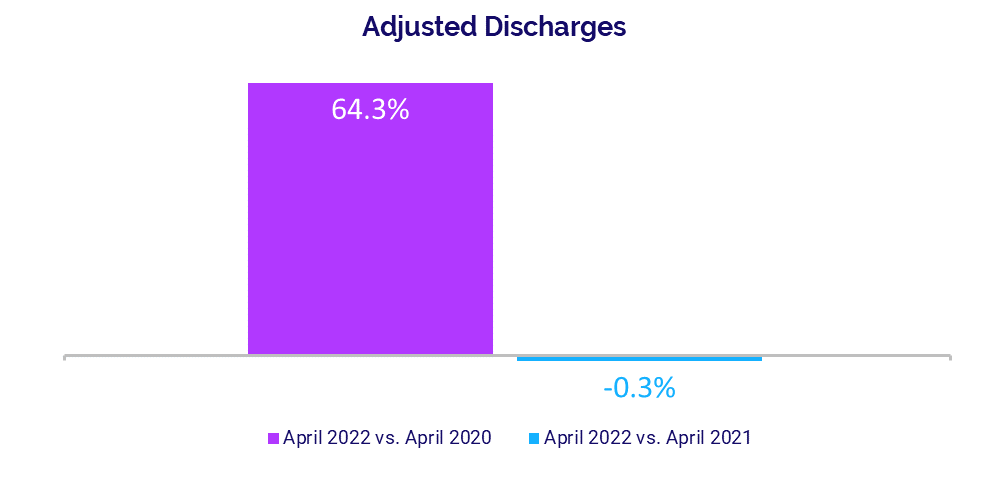
- Adjusted Discharges: -0.3%
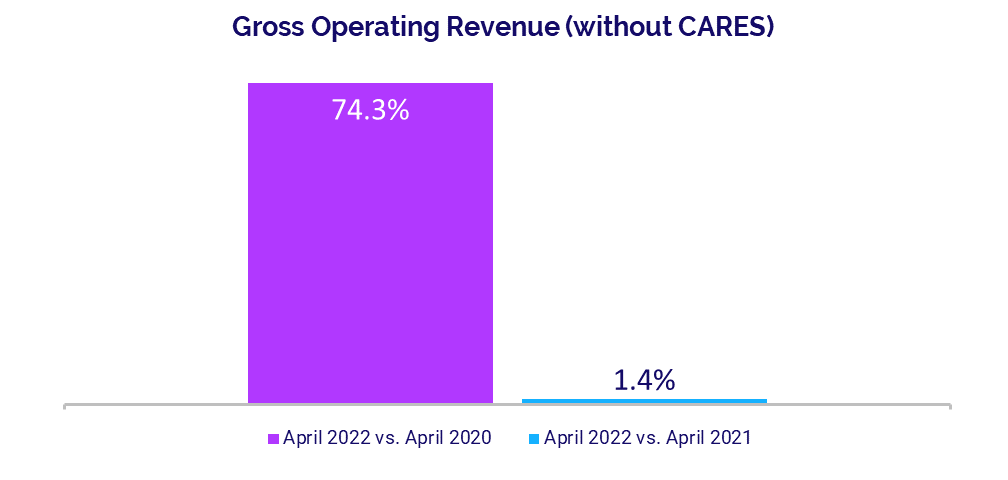
- Gross Operating Revenue: +1.4%
Operating Margin Declines Persist
Hospital margins dropped significantly year-over-year in April but rose above levels seen in the early days of COVID-19 in April 2020. The median hospital Operating Margin was down -77.9% year-over-year but up 88.1% compared to April 2020, not including federal Coronavirus Aid, Relief, and Economic Security (CARES) funding.i With CARES, the median Operating Margin was down -76% year-over-year but up 67.6% versus April 2020.
Median Operating Earnings Before Interest, Taxes, Depreciation, and Amortization (EBITDA) Margin was down -56.1% year-over-year but jumped 103.9% versus April 2020, without CARES. With CARES, the metric was down -51.5% compared to April 2021 but up 76.5% versus April 2020. Margins declined between -51% and -62% year-over-year across all regions, with hospitals in the Great Plains having the biggest decrease.
Expenses Remain on the Rise
Adjusted expenses rose across most metrics compared to April 2021 levels. Labor Expense per Adjusted Discharge had the biggest year-over-year increase at 15%, driven by persistent workforce shortages. Staffing levels — as measured by Full-Time Equivalents (FTEs) per Adjusted Occupied Bed (AOB) — were essentially flat, increasing just 0.2% year-over-year. This suggests labor cost increases continue to be driven primarily by hospitals paying higher wages to retain employees.
Total Expense per Adjusted Discharge was up 10.1% year-over-year while Non-Labor Expense per Adjusted Discharge increased 5.5%. Compared to April 2020, however, Total Expense per Adjusted Discharge decreased -21.9%, Labor Expense per Adjusted Discharge was down -23.2%, and Non-Labor Expense per Adjusted Discharge declined -25.3%.
Volume Performance Weakened
Hospital volumes remained weak three months after the Omicron surge in January. Adjusted Discharges were nearly flat, decreasing just -0.3% compared to April 2021. Adjusted Patient Days and Emergency Department (ED) Visits both had slight year-over-year increases at 1.8% and 0.8%, respectively. Operating Room Minutes were down -6.2% over the same period.
Despite poor performance year-over-year, volumes increased across most metrics versus lows seen during the second month of the pandemic. Compared to April 2020, Adjusted Discharges jumped 64.3%, Adjusted Patient Days rose 62.2%, and ED Visits increased 58%. Not surprisingly, Operating Room Minutes had the biggest increase at 156.8% versus April 2020, when many hospitals halted nonurgent procedures at the onset of the pandemic.
Revenues See Mixed Results
Despite weak volume performance, hospitals saw some moderate year-over-year revenue gains in April and significant gains compared to April 2020. Year-over-year, Gross Operating Revenue increased 1.4% and Outpatient Revenue rose 3.5%, but Inpatient Revenue decreased -1.3%. Compared to April 2020, however, Gross Operating Revenue rose 74.3%, Inpatient Revenue increased 39.5%, and Outpatient Revenue jumped 124% from lows seen during shutdowns early in the pandemic.
Looking at revenue by region, Net Patient Service Revenue (NPSR) per Adjusted Discharge decreased year-over-year in the South and Northeast/Mid-Atlantic but rose year-over-year in the Midwest (2.9%), Great Plains (5.1%), and West (8%).
Physician Practice KPIs
May 2022
Physician practices continued to contend with rising expenses and increased patient demand in April. The level of investment needed to support physician practices remained on an upward trajectory, once again surpassing both 2021 and 2020 levels.
The ongoing impacts of inflation, supply chain issues, and nationwide workforce shortages contributed to higher per-physician expenses. Physician productivity also continued to rise, indicating an increase in patient volumes. Meanwhile, staffing levels saw moderate increases from 2021 but decreased relative to 2020.
The top five physician financial and operational KPIs for April annualized versus 2021 are:
- Investment: +18.4%
- Total Direct Expense: +8.6%
- Productivity: +11.5%
- Revenue: +3.6% Support Staff Levels: +3.3%
Physician Investments Exceed Prior Years
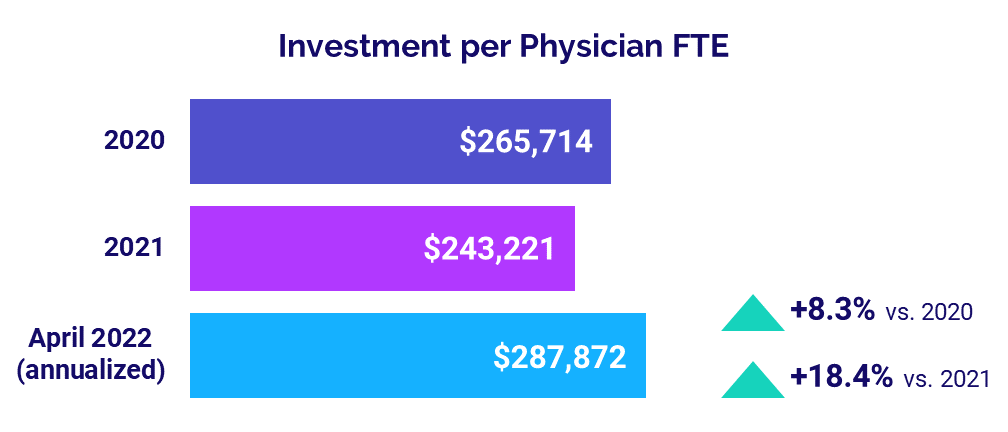
The level of investment needed to support physician practices continued to rise in April, surpassing 2021 and 2020 levels. The annualized median Investment per Physician FTE was $287,872 in April, up 18.4% from 2021 levels and up 8.3% compared to 2020.
The median Investment per Physician FTE increased compared to 2021 and 2020 across most specialties. Obstetrics and Gynecology (Ob/Gyn) had the biggest increases, up 46% from 2021 and 19.2% from 2020. Primary Care was the only specialty to see a decrease compared to prior years, with the metric down -15.5% from 2020.
By region, April annualized Investment per Physician FTE increased for physician practices nationwide compared to 2021 and rose for all but the Midwest (-8.1%) versus 2020. The West had the biggest increases, with the metric up 37.8% versus 2021 and 22.7% versus 2020.
Physician Expenses Steepen
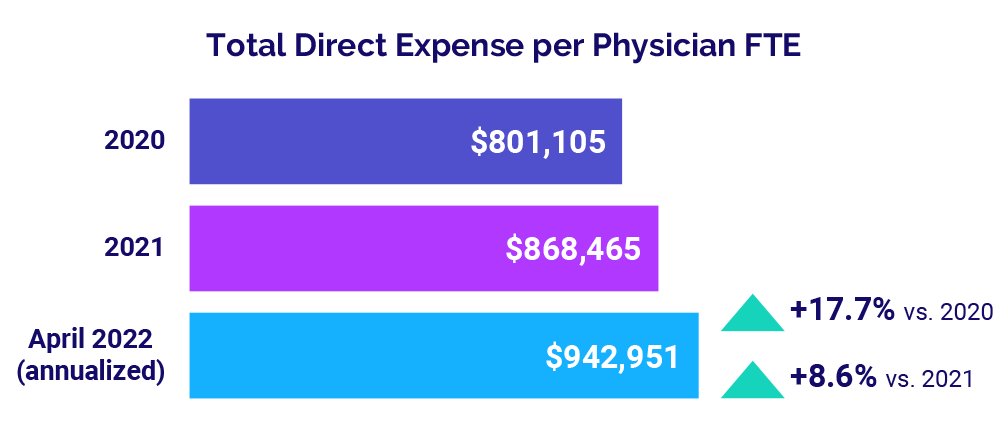
Physician expenses remained on the rise, as the ongoing effects of inflation, supply chain issues, and nationwide workforce shortages take a toll. April annualized median Total Direct Expense per Physician FTE (including advanced practice providers) was $942,951, up 8.6% versus $868,465 in 2021 and up 17.7% compared to $801,105 in 2020.
Practices across all specialties and all regions showed progressive increases in the metric from 2020 to April 2022. Primary Care had the biggest increase from 2021 compared to other specialties at 9.9%, with the metric rising to $941,759 in April (annualized). By region, the West had the biggest increases, with the metric rising 15% from 2021 and 27.6% from 2020.
Physician Productivity Increases
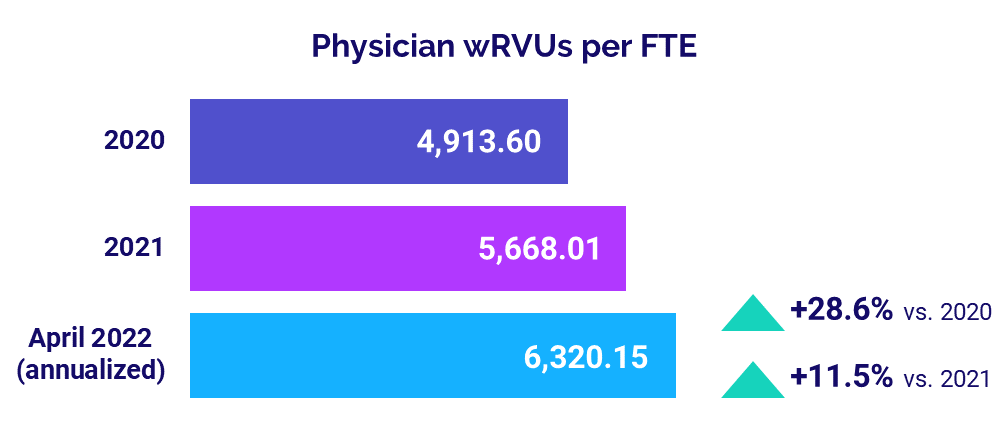
Physician productivity continued to rise in April, indicating an increase in patient volumes. The annualized median Physician work Relative Value Units (wRVUs) per FTE for the month were 6,320.15. The metric was up 11.5% versus 2021 and 28.6% compared to 2020.
Physician practices across all specialties saw productivity increases from 2020 through to April 2022 (annualized). Ob/Gyn had the biggest increase from 2021 at 14.9% while Medical Specialties had the biggest increase from 2020 at 29.7%.
Physician Revenues Rise with Demand
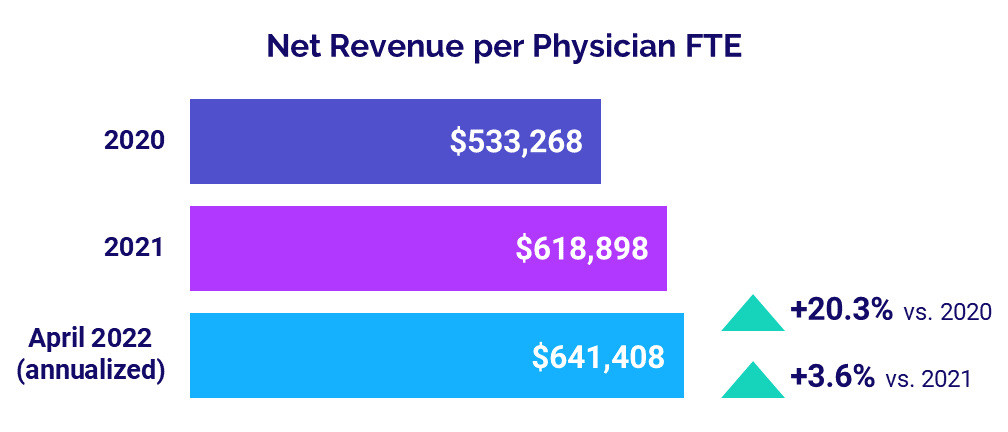
Physician revenues also continued to rise with higher levels of physician productivity and increased patient demand. The median annualized Net Revenue per Physician FTE (including advanced practice providers) for April was $641,408. That represents an increase of 3.6% compared to 2021 and an increase of 20.3% compared to $533,268 in 2020.
The metric rose for all specialties compared to both 2021 and 2020, with Hospital-based Specialties seeing the biggest increases at 9.1% and 19.8%, respectively.
Net Revenue per Physician FTE increased for physician practices in all regions compared to 2020 and for four of five regions versus 2021. The Great Plains was the only region to see a slight decrease for the metric at -0.2% compared to 2021.
Staffing Levels Up from 2021
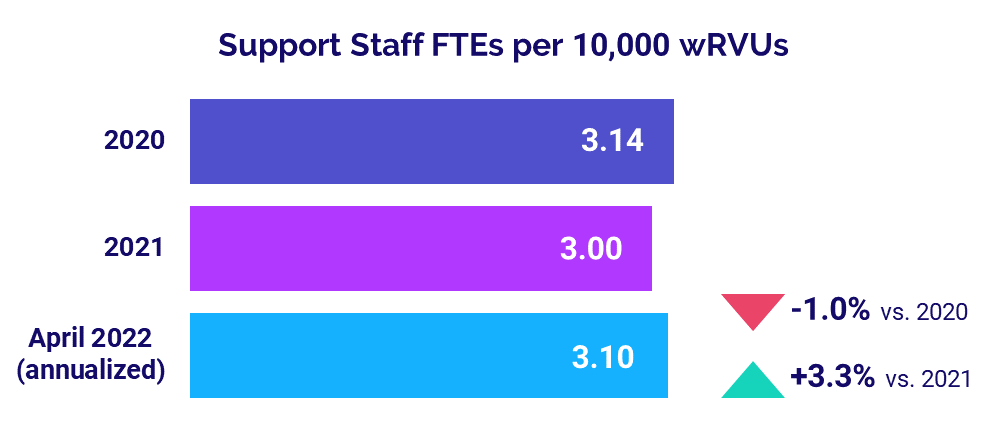
Staffing levels increased, with Support Staff FTEs per 10,000 wRVUs rising 3.3% from 2021 to 3.10 in April 2022 annualized. Compared to the first year of the pandemic in 2020, however, the metric was down -1.0%.
Looking across different specialties, Support Staff FTEs per 10,000 wRVUs increased compared to 2021 and 2020 across three of four specialties. Ob/Gyn had the biggest increases, with the metric up 9.1% from 2021 and 11.3% from 2020. Primary Care was the only specialty to see decreases, with the metric down -6.7% versus 2021 and -10.9% versus 2020.
The Road Ahead for Healthcare
Rapidly rising costs remain one of the primary challenges for healthcare providers nationwide. The combined weight of nationwide workforce shortages, inflation, and ongoing supply chain issues is driving increasingly disproportionate growth in expenses relative to revenues.
As a result, hospitals, health systems, and other healthcare providers continue to see margin declines and investments needed to support insufficient physician practice revenues remain on the rise. Healthcare leaders must take decisive actions to contain the impacts of these trends. They need reliable data and analytics to assess current trends, anticipate future challenges, and make informed strategic decisions to set their organizations on a path toward greater financial stability.
Source: Syntellis’ Axiom™ Comparative Analytics, which offers access to real-time data drawn from more than 135,000 physicians from over 10,000 practices and 139 specialty categories, and from 500+ unique departments across more than 1,000 hospitals. Powered by Syntellis IQ, Comparative Analytics also provides data and comparisons specific to a single organization for visibility into how their market is evolving.

