Executive Summary
Tight Competition for Healthcare Workers Drives Up Hourly Rates
Healthcare providers face mounting expense pressures from nearly every angle as the challenges of the COVID-19 pandemic are exacerbated by nationwide workforce shortages and global supply chain issues. Hospitals, health systems, and other healthcare providers are increasingly vying for a shrinking supply of qualified professionals. There simply don’t seem to be enough individuals to fill positions vacated by droves of healthcare workers who are retiring or seeking greener pastures elsewhere due to pandemic-related burnout and an abundance of other opportunities. While there are many unknowns at this point about the Omicron variant, healthcare providers could face further pressures if the new variant leads to additional surges this winter.
“Retaining and recruiting top talent is more than paying higher wages,” said Tonia Breckenridge, managing director at Huron. “Healthcare organizations need to put an emphasis on rewarding and recognizing top performers in ways that are meaningful, including creating a safe environment where individuals are encouraged to challenge the status quo, think innovatively and bring new solutions forward, and addressing poor performers. High performers want to work with others that pull together and support each other in challenging times. Engaging top performers to solve for the issues we face today will have long term impact in redesigning the care model for the future.”
Still, as competition heats up, healthcare providers are offering higher wages to bolster recruitment and retention efforts, especially in areas where the pandemic has significantly heightened demand. Respiratory therapists, for example, are widely needed to treat mounting numbers of COVID-19 patients experiencing both short- and long-term respiratory complications resulting from the virus.
Our recent analysis shows that hourly rates for respiratory therapists jumped 11.5% in October compared to 2019 levels, more than three times the increase seen for physical therapists over the same period. At the same time, the growth in respiratory procedures slowed. This illustrates a persistent problem across the industry, as wages and labor costs continue to climb in key areas despite waning patient demand or decreased staffing levels.
For U.S. hospitals and health systems, escalating expenses driven largely by higher labor costs hit Operating Margins for the second month of declines in October compared to both 2020 and 2019 levels. Expenses also rose for physician groups nationwide throughout the month despite lower staffing levels.
Read this month’s report for these and other hospital and physician performance trends drawn from Syntellis’ analysis of data from more than 135,000 physicians and 1,000 hospitals. Key findings include:
- Hourly Rates for Respiratory Therapists rose 11.5% compared to pre-pandemic levels
- Respiratory Care Labor Expense per Procedure jumped 27.5% versus October 2019
- Hospital Operating Margins fell 15% versus October 2020
- Hospital Labor Expense per Adjusted Discharge increased 16.3% year-over-year
- Total Direct Expense per Physician rose 9.4% versus 2020
Steve Wasson
EVP and GM, Data and Intelligence Solutions
Syntellis Performance Solutions
Market Analysis
November 2021
Nationwide labor shortages are driving up hourly wages across healthcare, especially in high-demand areas heavily affected by the COVID-19 pandemic. Healthcare providers are struggling to fill positions and are raising pay to compete for a tight labor pool as workers retire or move on to contract positions or other opportunities.
Respiratory therapists have seen the most sizable increases, as their skills and expertise are vital to treating patients suffering respiratory complications resulting from COVID-19 infections. Our latest data from October shows that respiratory therapists have seen hourly rate increases more than three times higher than those for physical therapists over the past two years.
Pay increases are a primary cause of rising labor costs in healthcare, as evidenced by persistent increases in respiratory care labor costs even as procedure increases lessen. At the same time, escalating medical supply costs — due in part to global supply shortages — are further stressing an industry already stretched thin by the ongoing pandemic. Those pressures could increase this winter as healthcare providers nationwide face the unknowns of the new Omicron variant.
Key market analysis metrics from October 2021 compared to pre-pandemic levels in October 2019 include:
- Respiratory Therapist Hourly Rate +11.5%
- Respiratory Care Labor Expense per Procedure +27.5%
- Respiratory Care Procedures +4.3%
- Respiratory Therapist Hourly Rate Increase +$3.59
- Respiratory Care Medical Supply Expense per Unit of Service +55.9%
Workforce shortages drive up hourly wages
Hourly rates continue to climb across the industry as providers face fierce competition for workers amid high staff turnover rates fueled by pandemic burnout and nationwide workforce shortages. While some increases in hourly rates are due to annual merit and inflation increases, the rate of increases is notably higher in areas most affected by pandemic-related demands.
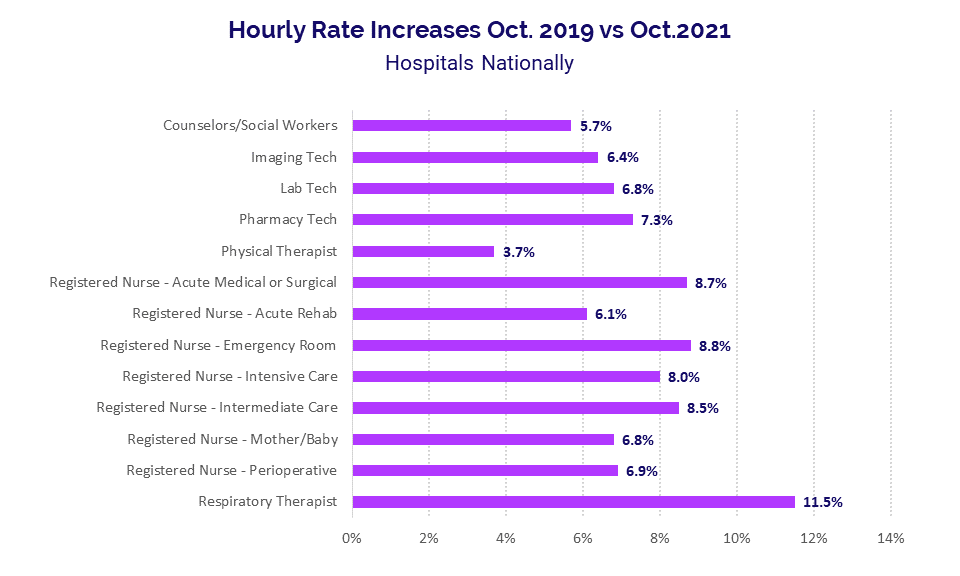
Respiratory therapists top the list, with hourly rates jumping 11.5% in October compared to the same period in 2019. That is more than triple the 3.7% increase in hourly rates seen for physical therapists over the same period, reflecting high demand for respiratory therapists as providers work to care for rising numbers of patients suffering short- and long-term respiratory effects of the COVID-19 virus.
Hourly rates for registered nurses (RNs) are also on the rise in several areas. From October 2019 to October 2021, hourly rates rose 8.8% for Emergency Room RNs, 8.7% for Acute Medical or Surgical RNs, 8.5% for Intermediate Care RNs, and 8% for Intensive Care RNs.
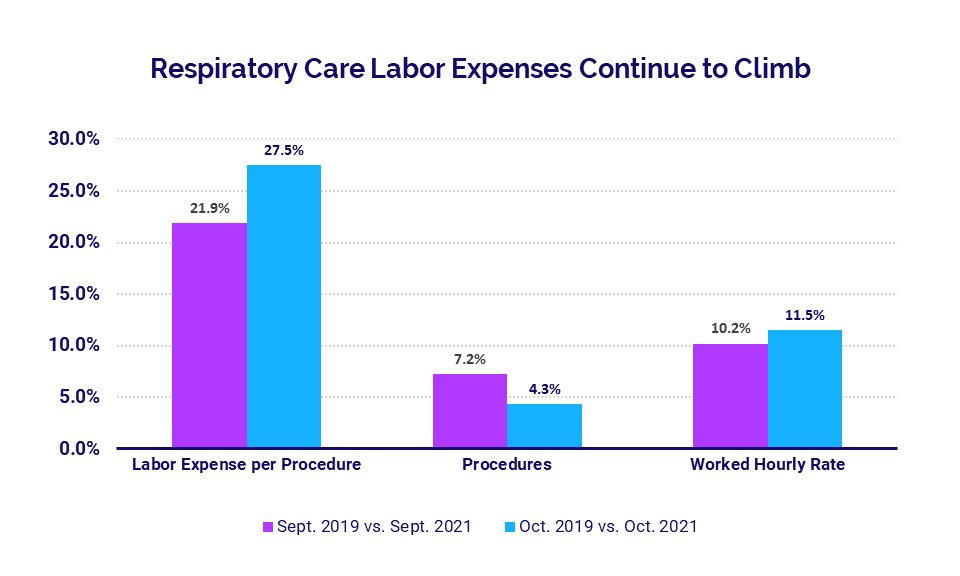
Hourly rate increases are contributing to rising healthcare labor costs (see Hospital KPIs section). In respiratory care, for example, Labor Expense per Procedure jumped 27.5% in October compared to October 2019, up from a 21.9% increase in September versus September 2019.
At the same time, procedure rates waned, rising just 4.3% in October versus October 2019 after increasing 7.2% the previous month versus September 2019. The inverse trends in these two metrics suggest that hourly rate increases are propelling overall labor cost increases despite lessening growth in demand.
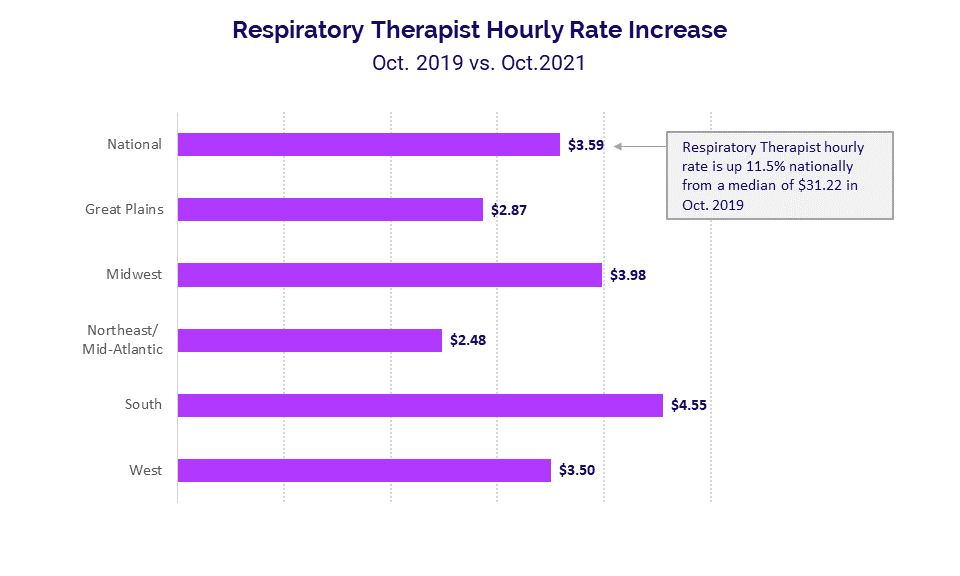
Looking at the dollar amounts tied to hourly rate increases, respiratory therapists nationwide saw a median increase of $3.59 in October compared to a median hourly rate of $31.22 in October 2019. The hourly rate incorporates all productive hours, including overtime, but median overtime for respiratory therapists increased just 1.8% nationally over the same period.
The South — which was hit especially hard by the COVID-19 Delta surge — had the highest median hourly rate increase at $4.55, followed by the Midwest at $3.98 and the West at $3.50.
Medical Supply Expense per Unit of Service
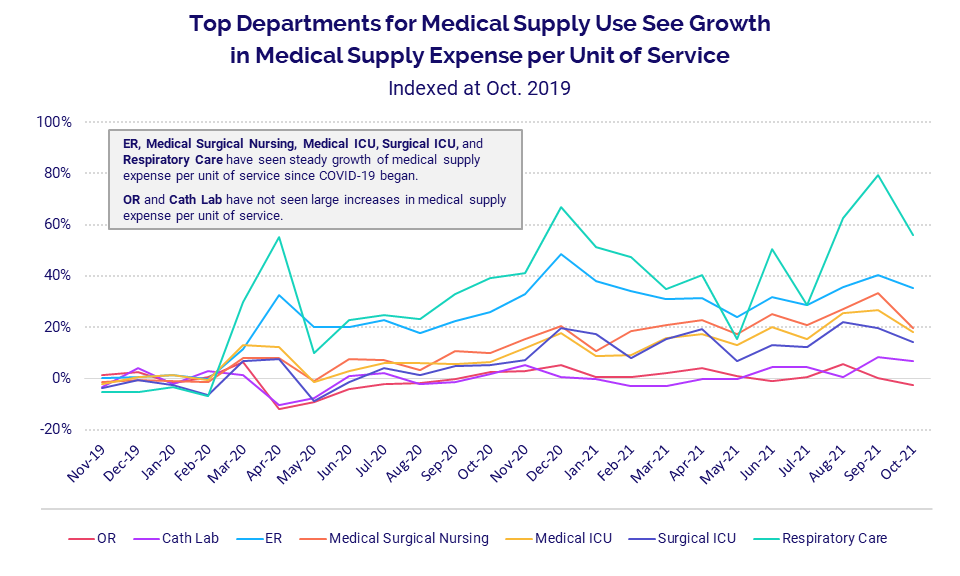
Rising medical supply expenses further compound industry pressures as healthcare providers continue to feel the reverberations of global supply chain issues. Medical supply expense per unit of service has steadily risen since the start of the pandemic for departments that interact with COVID-19 patients. Still, those increases have picked up in recent months.
Again, respiratory care has been disproportionately affected. The department had the highest increase in Medical Supply Expense per Procedure at 55.9% in October versus pre-pandemic costs in October 2019. Other areas experiencing sizable increases over the same period include ERs (35.2%), Medical Surgical Nursing (19.7%), Medical ICUs (18%), and Surgical ICUs (14.2%). Increases in medical supply expenses have been more moderate in other departments, such as Operating Rooms and Cath Labs.
Hospital KPIs
October 2021
Rising expenses continued to pummel U.S. hospitals and health systems in October, driving margins down significantly compared to both 2020 and 2019 levels despite sustained revenue increases. Swelling labor costs were a significant contributor, with year-over-year increases more than double those of non-labor expenses.
As revenues rose, inpatient revenue growth outpaced growth in outpatient revenues. Inpatient volumes also continued to increase in October, but at a slower rate than seen in recent months.
October 2021 financial KPIs for U.S. hospitals and health systems compared to October 2020 include:
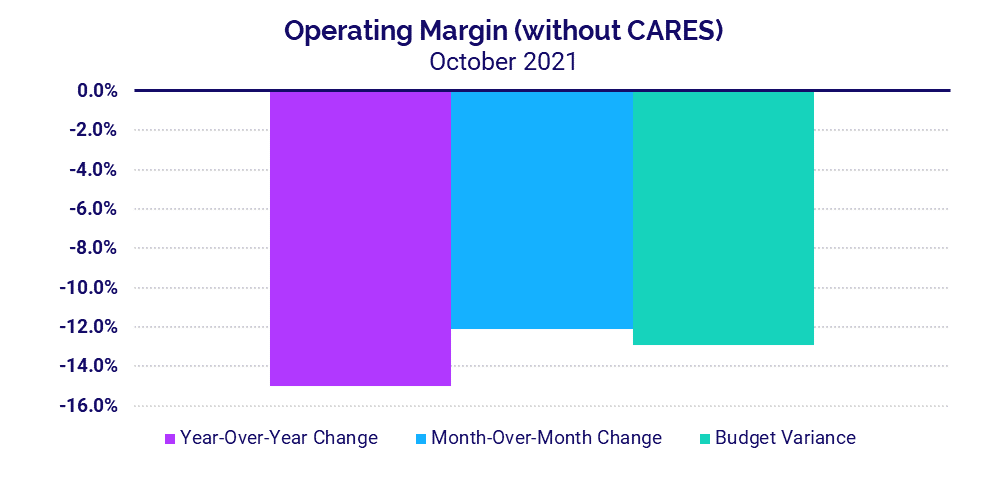
- Operating Margin (without CARES) -15%
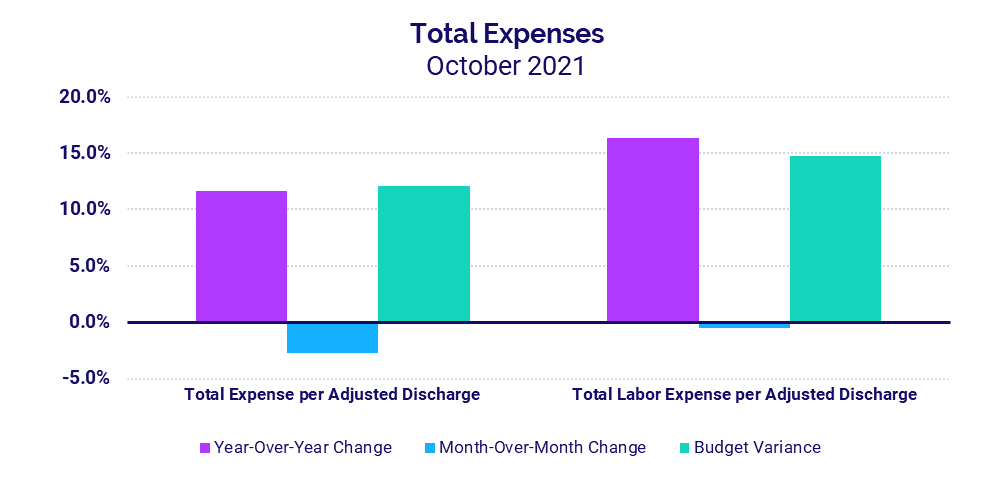
- Total Expense per Adjusted Discharge +11.6%
- Labor Expense per Adjusted Discharge +16.3%
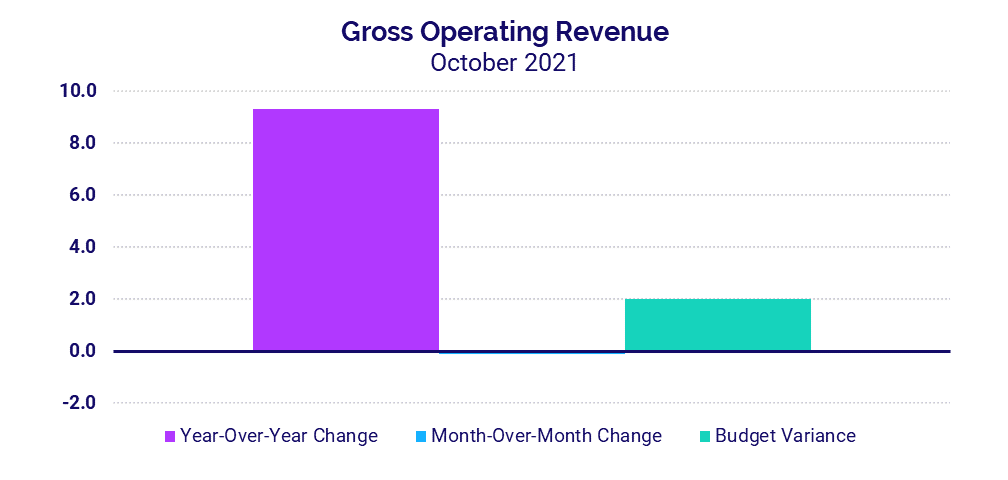
- Gross Operating Revenue +9.3%
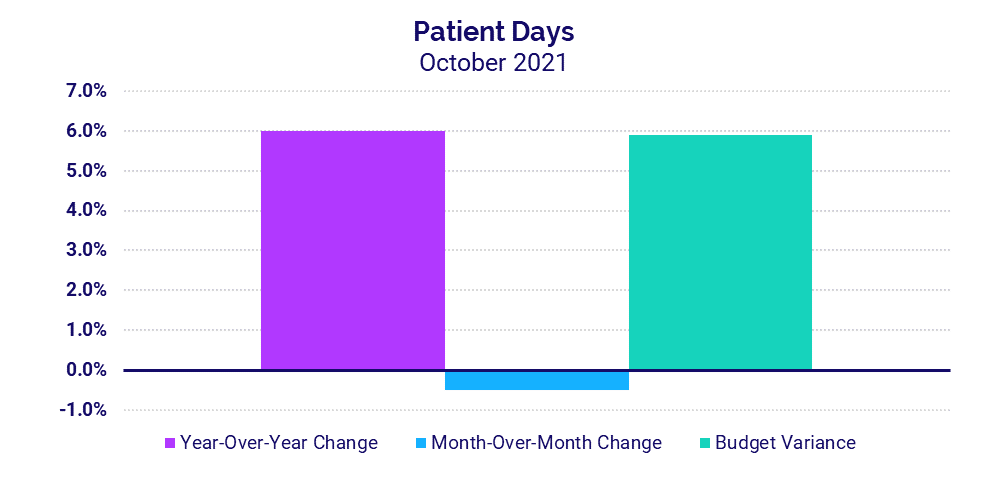
- Patient Days +6%
Margins hit with a second month of declines
Not including federal Coronavirus Aid, Relief, and Economic Security (CARES) Act funding, the median hospital Operating Margin declined -15% in October versus October 2020 and –12.1% versus September of this year. Compared to before the pandemic in October 2019, Operating Margin (without CARES) was down -31.5%. With CARES, Operating Margin fell -19.1% versus October 2020.
Operating Earnings Before Interest, Taxes, Depreciation, and Amortization (EBITDA) Margin decreased -16.8% year-over-year without CARES and -17.1% with CARES. Hospitals in regions significantly impacted by the last COVID-19 surge continued to see margin impacts. Hospitals in the Midwest, South, and West all saw Operating EBITDA Margin (without CARES) fall year-over-year and -12% or more below budget for the month.
Rising labor costs push expenses up
Total Expense per Adjusted Discharge rose 11.6% in October versus the same month in 2020 and 25.6% versus October 2019. A 16.3% year-over-year jump in Labor Expense per Adjusted Discharge fueled the increase. Compared to October 2019, Labor Expense per Adjusted Discharge was up 27.4%. The increases came despite a more than -4% drop in Full-Time Equivalents (FTEs) per Adjusted Occupied Bed (AOB) versus October 2020 and 2019, demonstrating the influence of higher pay in driving up labor expenses even with decreased staffing levels.
Non-Labor Expense per Adjusted Discharge was up 6.8% for the month versus October 2020. The South had the biggest year-over-year increases across all expense metrics, up 24.4% for Total Expense per Adjusted Discharge, 32.5% for Labor Expense per Adjusted Discharge, and 13.2% for Non-Labor Expense per Adjusted Discharge.
Revenues remain on the rise
Gross Operating Revenue was up 9.3% in October versus October 2020 and 7.6% compared to October 2019. Inpatient Revenues rose 10.2% year-over-year versus 2020 and 11.8% versus 2019. Outpatient Revenue grew slower, up 8.6% compared to October 2020 and 5.8% compared to October 2019.
Looking at revenues by region, Net Patient Service Revenue (NPSR) per Adjusted Discharge once again rose year-over-year and above budget for hospitals of all sizes and across all regions. Hospitals in the West had the most considerable increase to budget for the metric at 18.3% but tied with hospitals in the South for the biggest year-over-year increase of 13.1%.
Inpatient volume increases wane
Hospitals continued to see increases in inpatient volumes in October, but the growth rate was down compared to recent months. Patient Days rose 6% versus both October 2020 and October 2019. That follows an 11.4% year-over-year bump the prior month versus September 2020. Adjusted Discharges were flat compared to October 2020.
Hospitals in the West, Northeast/Mid-Atlantic, South, and Midwest all saw Patient Days rise above budget and more than 4% year-over-year in October. The Great Plains also was above budget for the metric but was the only region to see Patient Days drop (-7.6%) versus October 2020.
Physician Practice KPIs
October 2021
According to annualized data from October, U.S. physician practices also saw expenses continue to increase despite lower staffing levels. Physician productivity increased significantly compared to lows seen with pandemic-related volume declines throughout 2020. Physician revenues remained on the rise as a result. Support staffing and the level of investment required to supplement physician practices both declined on an annualized basis relative to 2020.
The top five physician financial and operational KPIs from annualized October 2021 data compared to 2020 are:
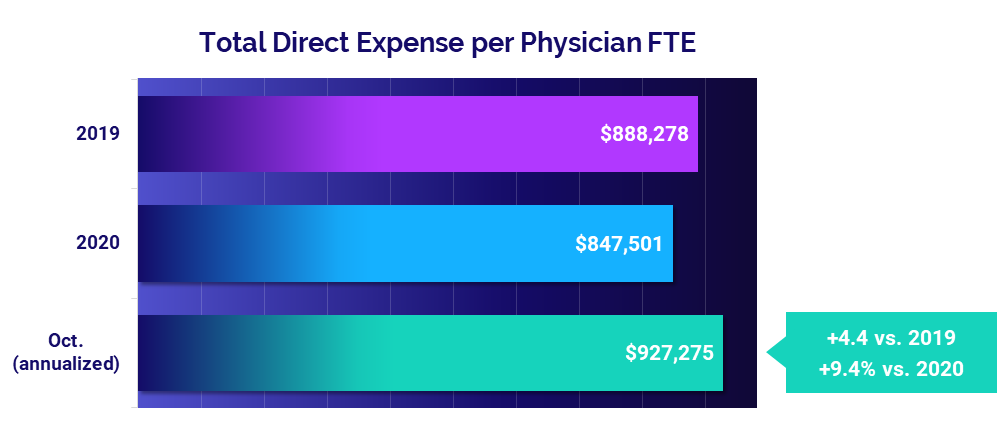
- Total Direct Expense: +9.4%
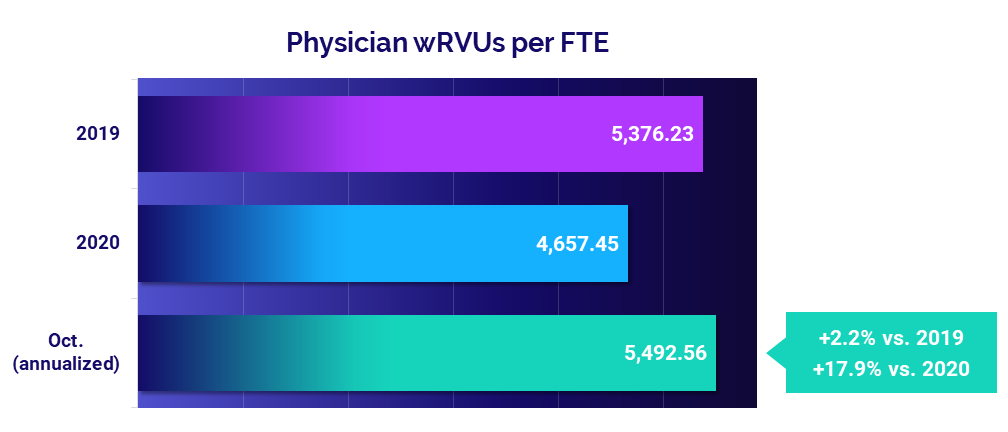
- Productivity: +17.9%
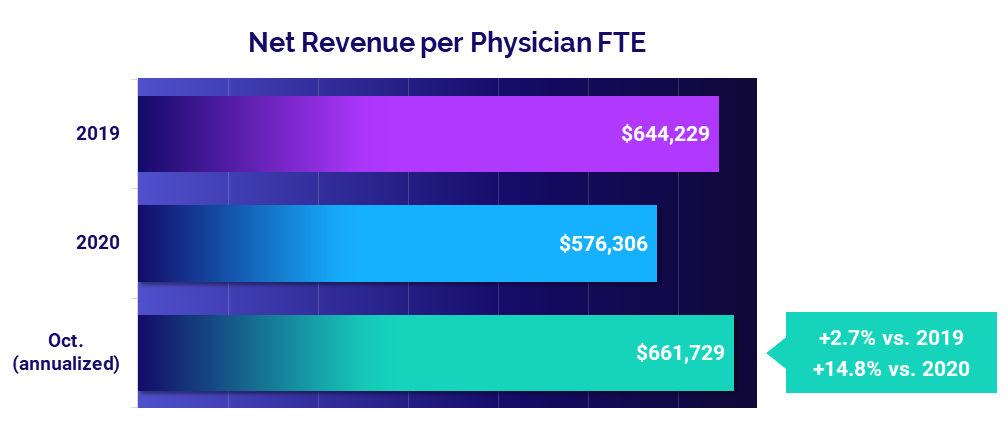
- Revenue: +14.8%
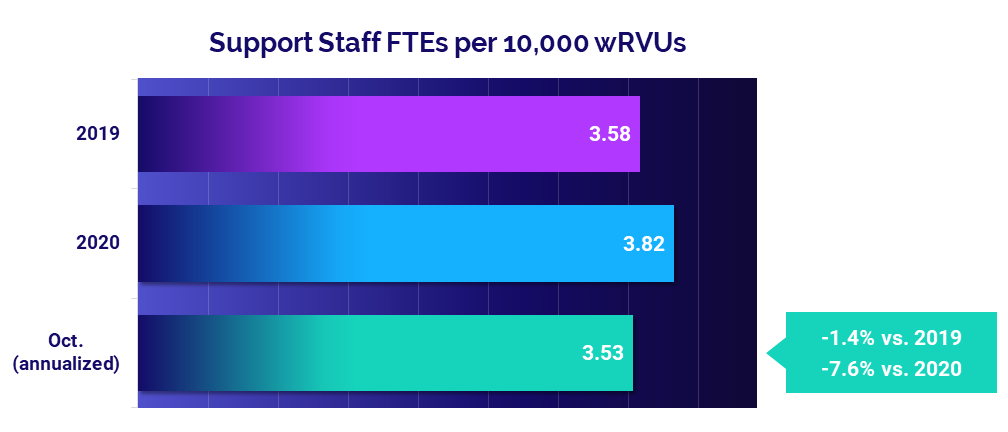
- Support Staff Levels: -7.6%
- Investment: -4.1%
Expenses see sustained increases
The median annualized Total Direct Expense per Physician FTE (including advanced practice providers or APPs) increased 9.4% to $927,275 in October versus 2020 levels. Compared to before the pandemic in 2019, Total Direct Expense per Physician FTE was up 4.4%.
Physician practices in the South had the biggest increase compared to 2020 at 12.6%, followed by the West at 11.5% and the Midwest at 9.7%. Medical Specialties had the biggest increase versus 2020 compared to other specialty groups at 12.9%, followed by Obstetrics and Gynecology at 10.8%.
Physician productivity accelerates
Physician productivity jumped in October, with Physician work Relative Value Units (wRVUs) per FTE up 17.9% versus 2020, when efforts to reduce the spread of COVID-19 drove down patient volumes at practices nationwide. Physician wRVUs per FTE remained close to pre-pandemic levels, up just 2.2% from 2019.
Medical Specialties had the largest increase in productivity versus 2020 levels, with Physician wRVUs per FTE up 21.7%. Primary Care was next at 19.9% year-over-year, followed by Surgical Specialties at 18.8%.
Physician revenues continue to rise
Physician revenues continued to recover from 2020 lows. The median Net Revenue per Physician FTE (including APPs) was $661,729 in October (annualized), up 14.8% from 2020. The metric performed close to pre-pandemic levels, rising just 2.7% compared to 2019.
The West had the largest increase in Net Revenue per Physician FTE, with the metric up 19.6% compared to 2020. The Northeast/Mid-Atlantic was next, with a year-over-year increase of 17.1%. Physician revenues were up by double digits year-over-year across all specialties, with Medical Specialties seeing the biggest increase at 19.8%.
Staffing levels drop
Support Staff FTEs per 10,000 wRVUs fell -7.6% from 2020 levels, according to the annualized October results. Compared to 2019 levels, however, Support Staff FTEs per 10,000 wRVUs were down just -1.4%. The declines clearly show that factors other than staffing levels are inciting rising physician expenses.
Staffing decreases were most pronounced for Medical Specialties, which saw October annualized Support Staff FTEs per 10,000 wRVUs drop -10.7% from 2020. Primary Care was next with a year-over-year decline of -8.4%.
Investments decline despite higher expenses
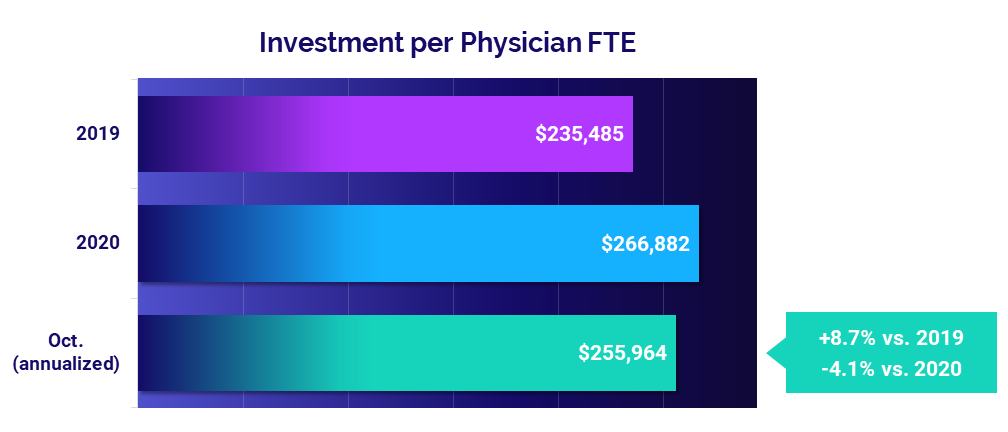
The level of investment needed to support physician practices declined in October on an annualized basis, despite rising expenses. Investment per Physician FTE dropped -4.1% to a median of $255,964 compared to 2020 levels but rose 8.7% versus 2019.
Practices in the Midwest saw a larger decline in Investment per Physician FTE than other regions, with the metric down -21.4% year-over-year. The Great Plains was next at -15%, while all other regions saw decreases or increases equaling less than 1%. Hospital-based Specialties was the only specialty group to see an increase in Investment per Physician FTE at 5.3%.
The Road Ahead for Healthcare
Rising expenses across healthcare are squeezing an industry already strained by the ongoing pressures of the COVID-19 pandemic. Nationwide labor shortages and global supply chain challenges further compound the issue, hitting healthcare providers with a heavy double blow that will make it even harder for them to build financial health and stability in a post-COVID environment.
Our October 2021 market analysis and key performance indicators reflect the continued repercussions of those pressures on providers and the industry overall. The current trends are not sustainable for the nation’s hospitals, health systems, and physician groups. Healthcare leaders will need to find better solutions going forward to address widespread labor shortages, strengthen recruitment and retention, and control rising labor and non-labor expenses.
For an in-depth understanding of the changes to healthcare’s financial landscape, leaders need reliable data to track KPIs in real time, identify opportunities for improvement, and effectively guide recovery efforts. Only then can the nation’s hospitals, health systems, and physician practices position themselves to make informed planning decisions to ensure exceptional patient care and long-term financial sustainability.
Source: Syntellis’ Axiom™ Comparative Analytics, which offers real-time data drawn from more than 135,000 physicians from over 10,000 practices and 139 specialty categories, and from 500+ unique departments across more than 1,000 hospitals. Powered by Syntellis IQ, Comparative Analytics also provides data and comparisons specific to a single organization for visibility into how their market is evolving.
Regional data is broken down by state. The Northeast/Mid-Atlantic includes ME, VT, NH, MA, RI, CT, NY, PA, NJ, DE, MD, WV, and VA. The South includes FL, TX, LA, MS, AL, GA, SC, NC, OK, AR, TN, and KY. The Midwest includes WI, MI, IL, IN, and OH. The Great Plains includes ND, SD, NE, KS, MN, IA, and MO. The West includes CA, AZ, NM, NV, UT, CO, OR, ID, WY, WA, MT, AK, and HI.
Read more of our latest hospital and physician KPI data:

Market Analysis and Monthly Hospital & Physician KPIs: October 2023

Market Analysis and Monthly Hospital & Physician KPIs: September 2023
