Executive Summary
Staff Shortages Strain Healthcare Providers in September
U.S. healthcare providers continued to feel the sting of nationwide staffing shortages in September, further complicating efforts to address the lingering effects of the recent COVID-19 surge. Hospitals, health systems, and physician groups all saw expenses climb as they are forced to compete for a tightening labor pool.
Hospital intensive care units (ICUs) again faced disproportionately high patient volumes — including patients suffering severe COVID-19 symptoms — even as overall COVID-19 related hospitalizations began to wane. New hospital admissions of patients with COVID-19 dropped 35% throughout the month after spiking more than 500% from mid-June to early September. In the nation’s ICUs, however, Patient Days increased 27.8% in Medical ICUs, 23.9% in Surgical ICUs, and 17.3% in Pediatric ICUs compared to pre-pandemic levels. Hospitals in regions hard hit by the surge were most affected. The South had the biggest median increase in Medical ICU Patient Days at 48.5%, while the West was up 27.5% and the Northeast/Mid-Atlantic jumped 23%.
“These trends are playing out across most care settings, with staff fatigue and turnover affecting care delivery models,” said Judy Stroot, R.N., BSN, M.A., NEA-BC, managing director at Huron. “Hospitals continue to face significant challenges in retaining current employees and recruiting new employees. Organizations are using this time to take a step back and assess their core talent strategy and tactics, with a significant emphasis being placed on introducing innovative solutions to care delivery and re-examining total rewards offerings. Balancing near-term demands with long-term financial sustainability will be a critical success factor for healthcare organizations striving to emerge from this pandemic on solid financial footing.”
Respiratory care departments are a prime example of the challenges stemming from U.S. labor shortages. A steady increase in the hourly rate paid for respiratory therapists has kept Labor Expense per Procedure high, even as volumes have recovered from lows seen early in the pandemic. The hourly rate for respiratory therapists was up 10.2% in September versus September 2019. The median Labor Expense per Procedure was 21.9% higher than the same month in 2019, and has hovered about 20% above pre-pandemic levels since July 2020.
Overall hospital labor expenses also increased for the month. Labor Expense per Adjusted Discharge jumped 20.4% compared to September 2019 despite a 4.6% decrease in hospital staff per patient (measured as Full-time Equivalents per Adjusted Occupied Bed). Meanwhile, worldwide supply chain issues contributed to a 22.4% increase in Non-Labor Expense per Adjusted Discharge over the same period. Physician groups also saw expenses climb even as physician productivity and staffing levels remained relatively flat.
Read this month’s report for these and other trends in hospital and physician performance drawn from Syntellis’ analysis of data from more than 135,000 physicians and 1,000 hospitals. Other key findings include:
- Medical ICU Overtime rose as much as 5.1% for the worst-hit hospitals versus September 2019
- Hospital Operating Margin fell 9.4% compared to September 2020
- Hospitals’ Gross Operating Revenues increased 12.3% year-over-year
- Investment per Physician FTE rose 8.4% in the third quarter compared to the same period in 2020
Steve Wasson
EVP and GM, Data and Intelligence Solutions
Syntellis Performance Solutions
Market Analysis
September 2021
Respiratory care is a key example of a department feeling the repercussions of COVID-19 and related nationwide staffing shortages — due in part to high staff turnover from pandemic-related burnout. Labor costs for these departments have been significantly higher than pre-pandemic levels for more than 14 months. Global supply chain issues also contribute to high non-labor expenses for respiratory care.
Intensive care units (ICUs) felt the ongoing effects of the recent COVID-19 Delta surge in September. Even as overall COVID-19 related hospitalizations declined, hospital ICUs continued to care for high volumes of high acuity patients, including more severe COVID-19 cases.
Key market analysis metrics from September 2021 compared to pre-pandemic levels in September 2019 include:
- Respiratory Care Labor Expense per Procedure: +21.9%
- Respiratory Care Medical Supply Expense per Procedure: +79%
- Respiratory Care Procedures: +7.2%
- Medical ICU Patient Days (Nationally): +27.8%
- Medical ICU Patient Days in the South: +48.5%
Workforce shortages contribute to high respiratory care labor costs
High labor costs have plagued respiratory care departments nationwide since early in the pandemic, worsening over time with the mounting challenges of U.S. labor shortages. The median Labor Expense per Procedure spiked 55% in April 2020 as procedure volumes dropped with social distancing policies and other efforts to mitigate the virus’ spread. Procedure volumes have steadily recovered in recent months rising 7.2% in September compared to September 2019. Labor Expense per Procedure, however, has hovered about 20% higher than pre-pandemic levels since July 2020. Labor Expense per Procedure was up 21.9% in September compared to the same month in 2019.
Rising hourly rates for respiratory therapists are a contributing factor. In September 2021, the Worked Hourly Rate was up 10.2% versus September 2019. The high labor costs reflect broader issues across the healthcare industry, as organizations compete for a dwindling pool of healthcare professionals due to pandemic-related staff burnout and high rates of turnover and retirements.
Also like many U.S. healthcare providers, respiratory care departments face non-labor expense challenges due in part to global supply chain issues. Respiratory care supply expenses have been elevated throughout much of 2020 and 2021. In September, Medical Supply Expense per Procedure was up 79% compared to September 2019.
Medical ICUs
ICUs nationwide continued to see outsized patient volumes in Septembe relative to other nursing departments. Patient Days were up 27.8% in Medical ICUs, 23.9% in Surgical ICUs, and 17.3% in Pediatric ICUs compared to September 2019.
Increases were relatively moderate in August in the Midwest and Northeast/Mid-Atlantic, but they saw a significant bump in Medical ICU Patient Days in September as the effects of the Delta variant spread to those regions. Compared to pre-pandemic levels, median Patient Days rose 23% in the Northeast/Mid-Atlantic and 20.9% in the Midwest in September.Hospitals in the South and West saw the largest increases in Medical ICU Patient Days, continuing trends from August as those regions were heavily impacted by the Delta surge. Median Patient Days jumped 27.5% in the West compared to September 2019, and 48.5% in the South. Among the worst-hit hospitals in the South, Patient Days spiked as much as 74.8%.
Hospital KPIs
Medical ICU Overtime increased again in September relative to pre-pandemic levels, but not as much as in August. The median Medical ICU Overtime was up 2.5% in September versus the same month in 2019. Hospitals in the West had the biggest median increase at 3.2% for the month, and as much as 5.5% for the bottom quartile representing the hardest-hit hospitals.
September 2021
U.S. hospital and health system labor expenses continued to rise in September despite a decrease in hospital staffing levels. Global supply chain issues and high volumes of sicker patients requiring longer hospital stays also contributed to high expenses. Margins decreased in September as a result, even as revenues rose.
The September 2021 financial KPIs for U.S. hospitals and health systems compared to September 2020:
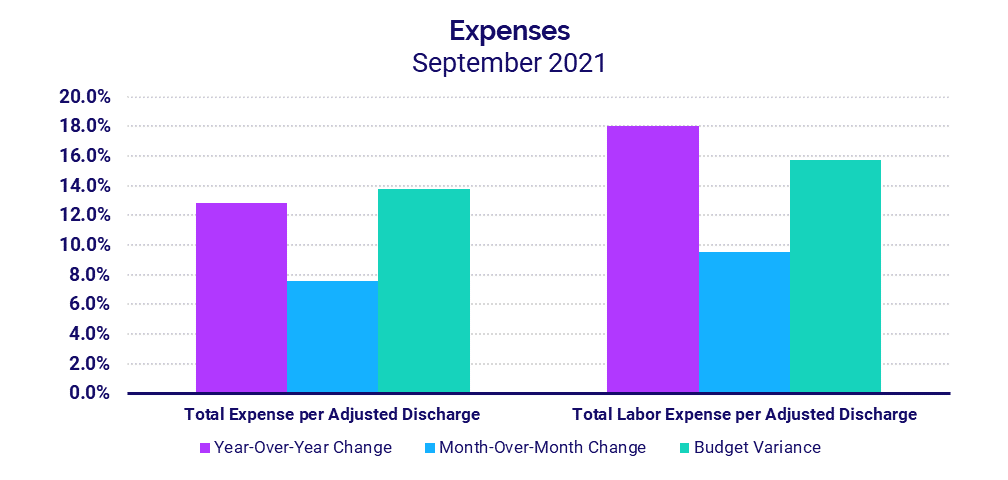
- Total Expense per Adjusted Discharge: +12.8%
- Labor Expense per Adjusted Discharge: +18%
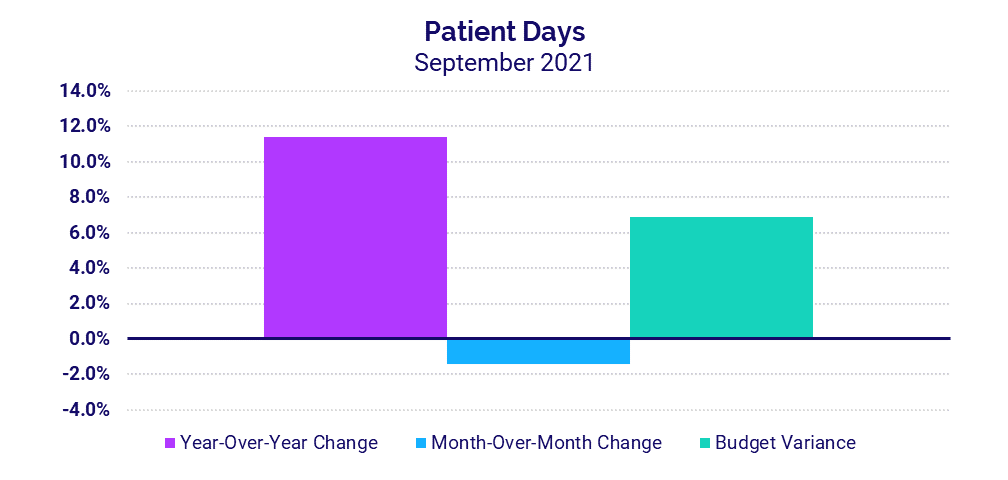
- Patient Days: +11.4%
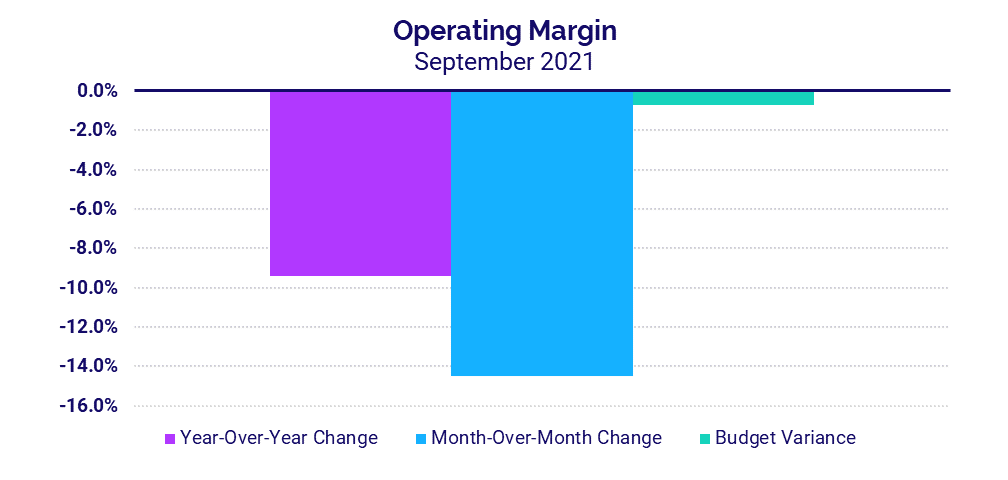
- Operating Margin: -9.4%
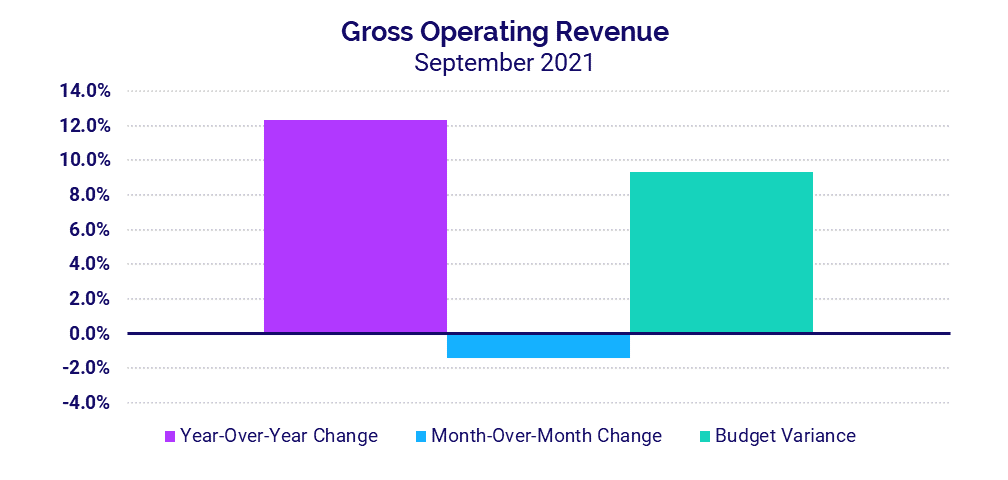
- Gross Operating Revenue: +12.3%
Workforce shortages drive up labor expenses
Labor Expense per Adjusted Discharge jumped 18% in September compared to September 2020 and 20.4% versus the same month in 2019. The increase came despite lower staffing levels reflected by a 4.6% decrease in Full-Time Equivalents (FTEs) per Adjusted Occupied Bed (AOB) versus pre-pandemic levels.
Worldwide supply chain issues contributed to a 22.4% increase in Non-Labor Expense per Adjusted Discharge compared to September 2019. Total Expense per Adjusted Discharge jumped 22% over the same period. Hospitals in regions most affected by the recent surge continued to see the biggest increases, with year-over-year Total Expense per Adjusted Discharge up 22.3% in the South and 14% in the West.
Inpatient volumes remain high following latest surge
Patient Days increased 11.4% year-over-year in September versus 2020 and 7.5% versus 2019 as hospitals continued to see an influx of patients needing inpatient care. For hospitals in the hard-hit South and West, Patient Days jumped more than 14.6% both year-over-year and above budget.
A 5% year-over-year increase in Average Length of Stay for the month also reflects a higher acuity of patients requiring longer hospital stays, including patients suffering more severe symptoms of COVID-19.
Margins drop during a difficult month
The median hospital Operating Margin decreased -9.4% in September versus the same month in 2020, both with and without federal funding from the Coronavirus Aid, Relief, and Economic Security (CARES) Act. Operating Earnings Before Interest, Taxes, Depreciation, and Amortization (EBITDA) Margin was down -13.2% year-over-year for the month with CARES and -14% without the aid.
Once again, hospitals in regions hit hardest by the recent COVID-19 surge were most affected. Hospitals in the Northeast/Mid-Atlantic, South, and West all saw Operating EBITDA Margin fall below budget and -25% or more year-over-year in September.
Revenues continue to increase
Gross Operating Revenue less CARES jumped 12.3% versus September 2020 and 18.2% versus September 2019, in part due to ongoing increases in inpatient volumes. Inpatient Revenue was up 19.4% year-over-year for the month, while Outpatient Revenue increased 10.8%.
Net Patient Service Revenue (NPSR) per Adjusted Discharge again rose year-over-year and above budget for hospitals of all sizes and across all regions in September. Hospitals in the South had the biggest increases compared to other regions, jumping 25.6% year-over-year and 22.9% above budget.
Physician Practice KPIs
September 2021
Physician groups also felt the impacts of U.S. workforce shortages in the third quarter. Practice expenses continued to climb disproportionately relative to year-over-year and quarter-to-quarter staffing levels and productivity. At the same time, practices saw increases throughout the quarter both in revenues and in the level of investment required to supplement physician revenues.
The top five physician financial and operational KPIs from third quarter 2021 data compared to the same quarter of 2020 are:
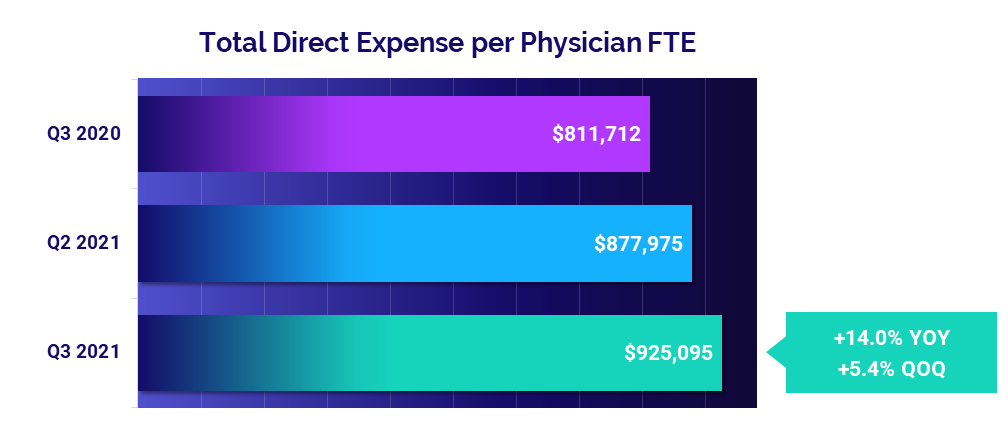
- Total Direct Expense: +14%
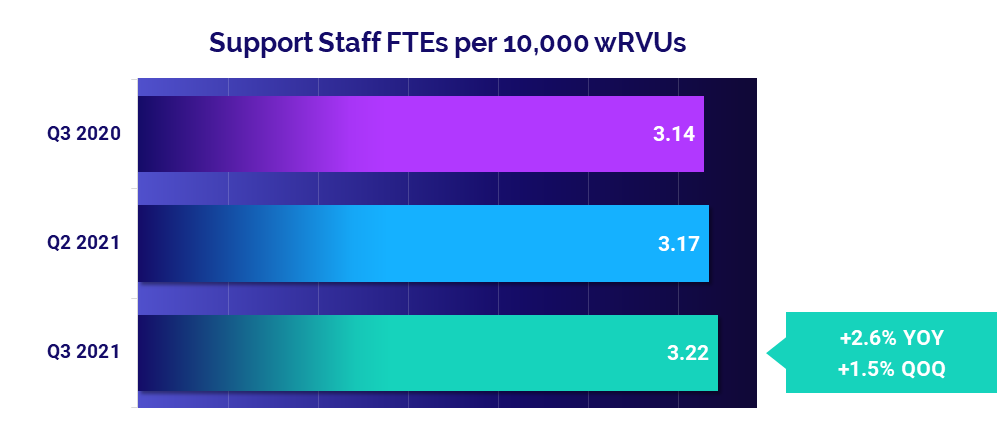
- Support Staff Levels: +2.6%
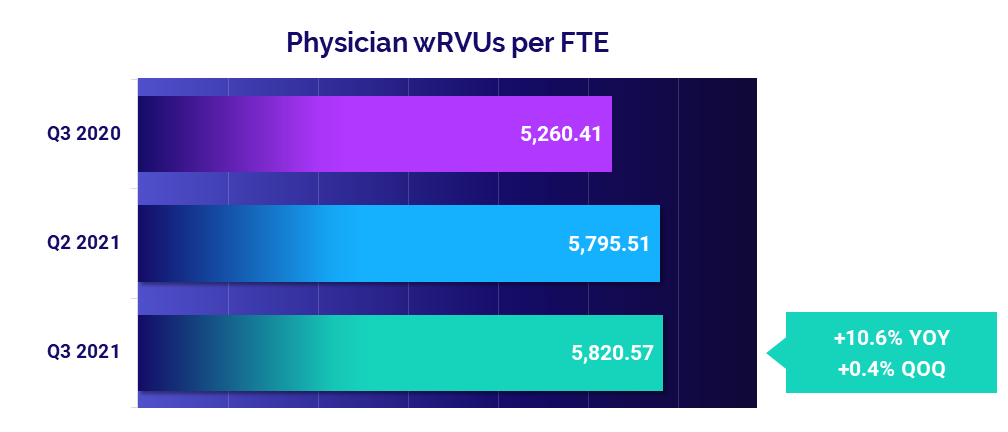
- Productivity: +10.6%
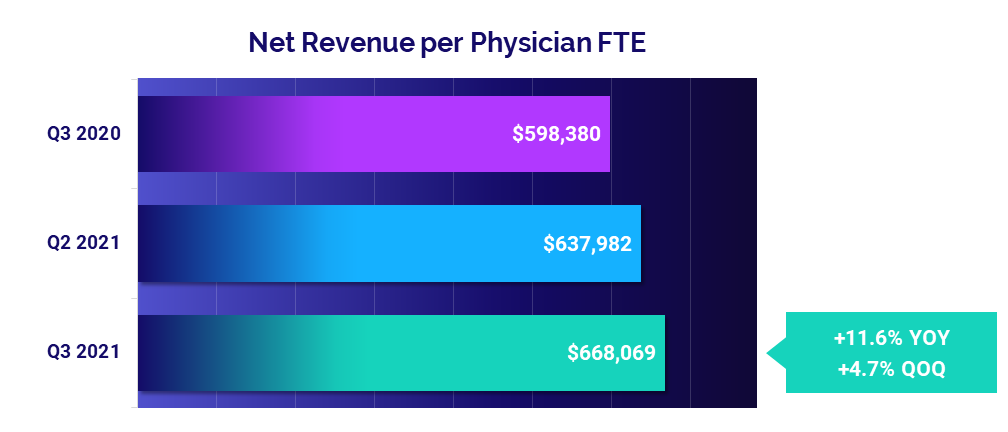
- Revenue: +11.6%
- Investment: +8.4%
Expenses continue to climb
The median annualized Total Direct Expense per Physician FTE (including advanced practice providers) jumped to $925,095 in the third quarter. That is up 5.4% from the second quarter of 2021 and up 14% from the third quarter of last year. By region, physician practices in the West and South saw the most significant increases at 17.7% and 16.3% respectively compared to the third quarter of 2020.
Hospital-based and Medical Specialties both saw the largest increases compared to other specialties, with Total Direct Expense per Physician FTE up 12.8% versus the third quarter of 2020 for both cohorts.
Staffing levels see moderate changes
Changes in staffing levels were moderate compared to expense increases, suggesting that other factors are driving higher costs. Annualized Support Staff FTEs per 10,000 work Relative Value Units (wRVUs) for the third quarter were up just 1.5% compared to the second quarter of 2021 and just 2.6% compared to the third quarter of 2020.
Surgical Specialties and Obstetrics and Gynecology (Ob/Gyn) had the biggest increases compared to the third quarter of 2020, with Support Staff FTEs per 10,000 wRVUs up 22.4% and 19.5%, respectively.
Physician productivity remains close to second-quarter levels
Physician productivity was virtually unchanged from the second to the third quarter with Physician wRVUs per FTE up just 0.4% over the period. Compared to low physician productivity driven by low patient volumes and COVID-19 mitigation efforts in the third quarter of 2020, however, the metric jumped 10.6%.
Primary Care had the biggest year-over-year jump in physician productivity compared to other specialties. Physician wRVUs per FTE rose 23.3% in the third quarter compared to the same period in 2020.
Physician revenues continue to rise
Physician revenues rose for a second consecutive quarter, reaching a median Net Revenue per Physician FTE of $668,069 in the third quarter. That represents an increase of 4.7% compared to the second quarter and 11.6% versus the third quarter of 2020.
Physician revenues increased quarter-to-quarter across all regions and across four of five specialty cohorts. Primary Care had the biggest increase compared to other specialties, with Net Revenue per Physician FTE up 11.8% from the second quarter. Surgical Specialties was the only cohort to see a slight quarter-to-quarter decrease at -1.3%.
Physician investments up for the quarter
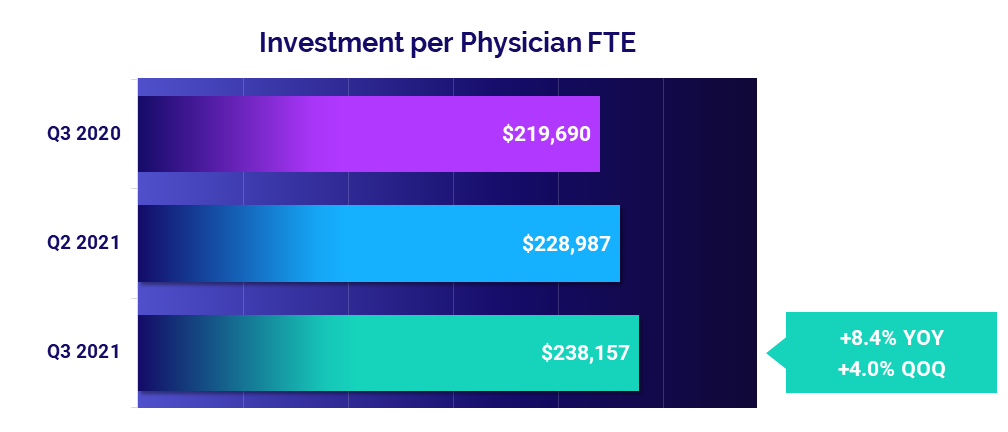
Practices across the country saw third-quarter increases in the median annualized Investment per Physician FTE required to supplement physician revenues. The metric rose to $238,157, up 4% from the second quarter and up 8.4% from the third quarter of last year.
Looking at different specialty cohorts, physician investments increased quarter-to-quarter for Ob/Gyn, Medical, and Surgical Specialties but decreased for Primary Care and Hospital-based Specialties. Compared to the third quarter of 2020, Primary Care saw the largest drop in Investment per Physician FTE at -160.2%, followed by Ob/Gyn at -102.3% over the same period.
The Road Ahead for Healthcare: Competition for Labor Will Remain a Troubling Challenge
The COVID-19 pandemic continues to have widespread implications for healthcare and the broader economy. The September 2021 key performance indicators reflect the strain of the pandemic on our nation’s healthcare workers, who have continued their vital work of caring for patients under unusually trying conditions for more than 18 months. Due to extreme burnout, many have chosen to retire early while others have moved on to higher-paying positions or shifted to careers in other fields.
Labor costs continue to escalate as a result, as hospitals, health systems, and physician groups must compete for a shrinking pool of qualified healthcare professionals. The pervasiveness of these trends is extremely troubling for the future of the healthcare. Layer on top of that high patient volumes and rising non-labor expenses exacerbated by global supply chain issues, and one can easily see the equation is unsustainable.
Looking forward, healthcare leaders will need to work together to find effective, long-term strategic solutions to control mounting labor and non-labor costs across the industry, while also strengthening recruitment and retention efforts and ensuring an ample supply of healthcare professionals for generations to come.
Source: Syntellis’ Axiom™ Comparative Analytics, which offers access to real-time data drawn from more than 135,000 physicians from over 10,000 practices and 139 specialty categories, and from 500+ unique departments across more than 1,000 hospitals. Powered by Syntellis IQ, Comparative Analytics also provides data and comparisons specific to a single organization for visibility into how their market is evolving.
Regional data is broken down by state. The Northeast/Mid-Atlantic includes ME, VT, NH, MA, RI, CT, NY, PA, NJ, DE, MD, WV, and VA. The South includes FL, TX, LA, MS, AL, GA, SC, NC, OK, AR, TN, and KY. The Midwest includes WI, MI, IL, IN, and OH. The Great Plains includes ND, SD, NE, KS, MN, IA, and MO. The West includes CA, AZ, NM, NV, UT, CO, OR, ID, WY, WA, MT, AK, and HI.
Read more of our latest hospital and physician KPI data:

Market Analysis and Monthly Hospital & Physician KPIs: October 2023

Market Analysis and Monthly Hospital & Physician KPIs: September 2023
