Executive Summary
Delta Drove Intense Increases in Demand in August
Rapid spread of the highly contagious Delta variant contributed to steep increases in demand for hospitals, health systems, and physician groups throughout August 2021, continuing dramatic upswings in volumes, expenses, and other key performance indicators seen in July. COVID-19 cases skyrocketed more than 1,000% nationwide over the two-month period from July 1 to August 31, with the Delta variant making up 98% of U.S. cases by early September.
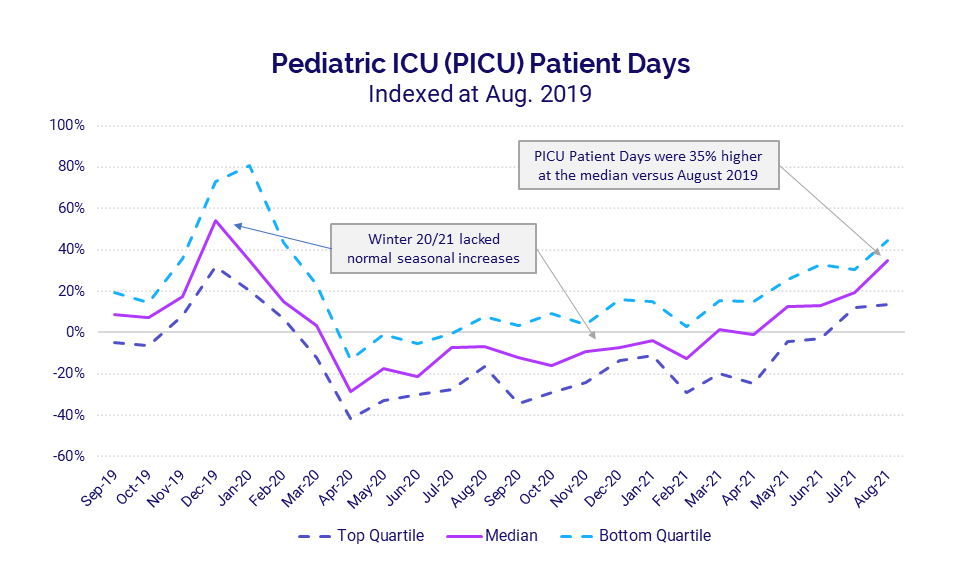
Intensive care units (ICUs) nationwide were hit especially hard, as mounting infections drove subsequent increases in the number of individuals suffering severe COVID-19 complications. Pediatric ICUs, in particular, saw dramatic volume increases as Delta led to higher levels of child hospitalizations. Pediatric ICU Patient Days jumped 35% in August versus pre-pandemic levels in August 2019. If the trend continues, we could be in for a harsh winter as pediatric ICUs cope with rising COVID-19 cases combined with typical seasonal volume increases from the flu and other infectious diseases.
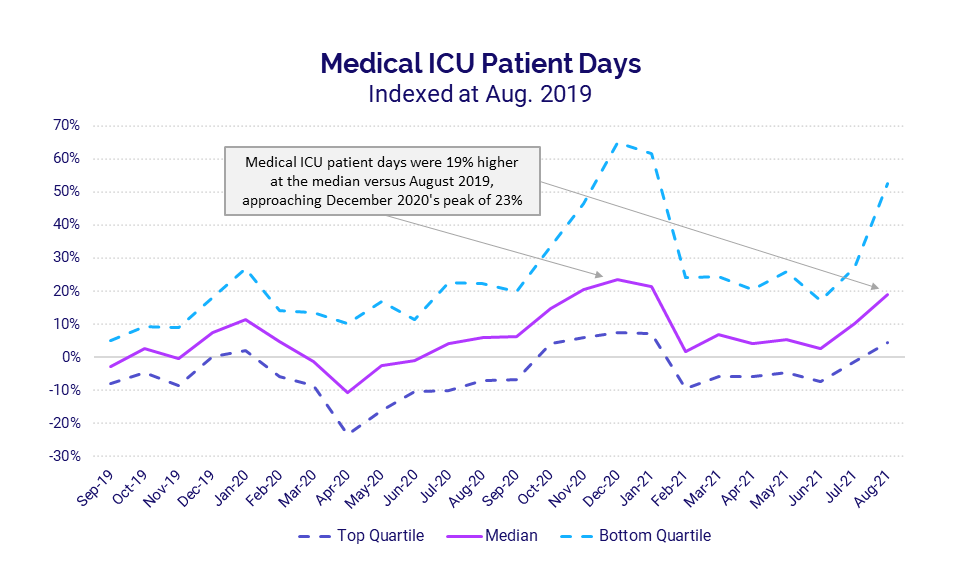
Adult ICUs also saw a second consecutive month of sharp increases, with Medical ICU Patient Days spiking 19% in August versus the same period in 2019 and approaching peaks seen during last winter’s surge. Hospitals in the South and West, where Delta infections have been disproportionately high, again saw the biggest increases in median Medical ICU Patient Days at 34% and 33%, respectively.
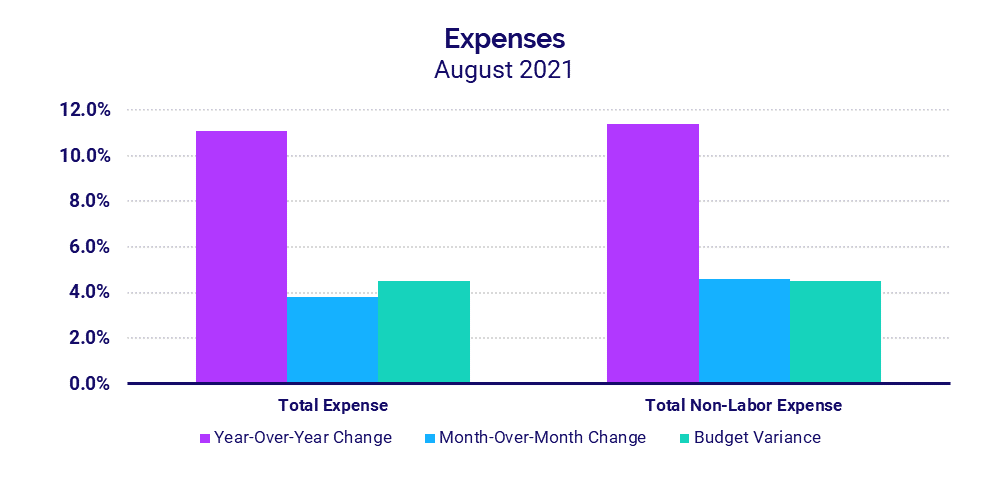
Looking at overall hospital inpatient volumes relative to 2020, Patient Days rose 12.4% year-over-year in August. Hospitals in the South again had the most significant increases, with Patient Days up 20.3%. The increased volumes contributed to an 11.1% increase in Total Expenses, driven largely by increased drug and supply expenses.
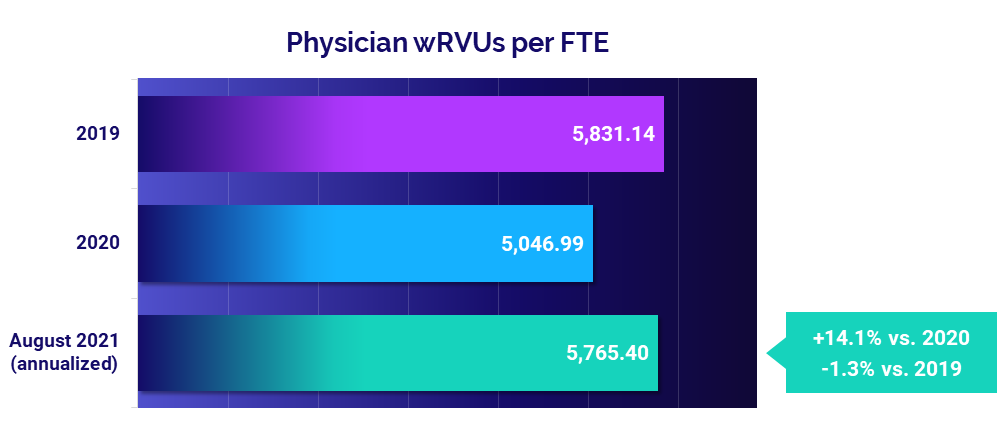
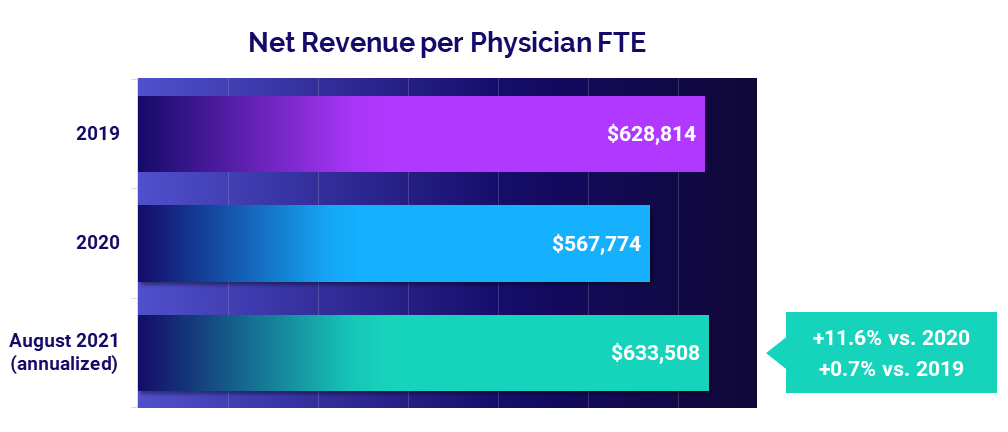
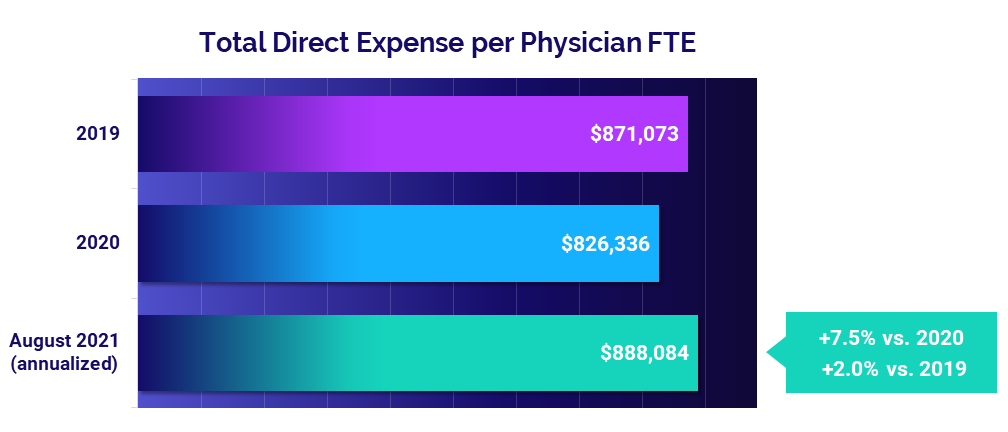
Physician practices also saw increased demand, which led to a 14.1% increase in physician productivity, measured as Physician work Relative Value Units (wRVUs) per Full-Time Equivalent (FTE) (annualized for August versus 2020). The rise in productivity contributed to an 11.6% jump in Net Revenue per Physician FTE and a 7.5% rise in Total Direct Expense per Physician FTE.
The following report highlights these and other hospital and physician performance trends drawn from Syntellis’ analysis of data from more than 135,000 physicians and 1,000 hospitals. Other key findings include:
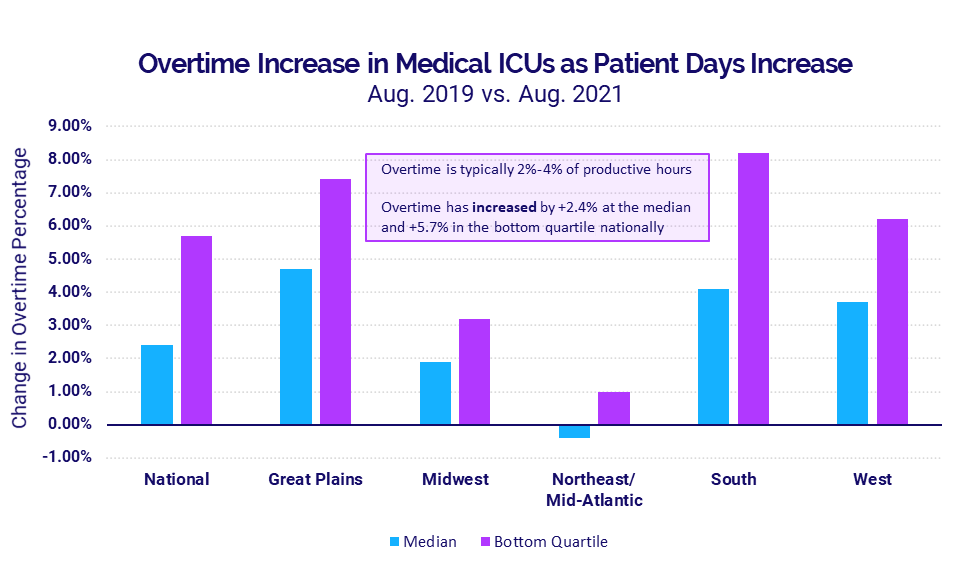
- ICU Overtime percentages in the hard-hit South rose 4.1% versus August 2019
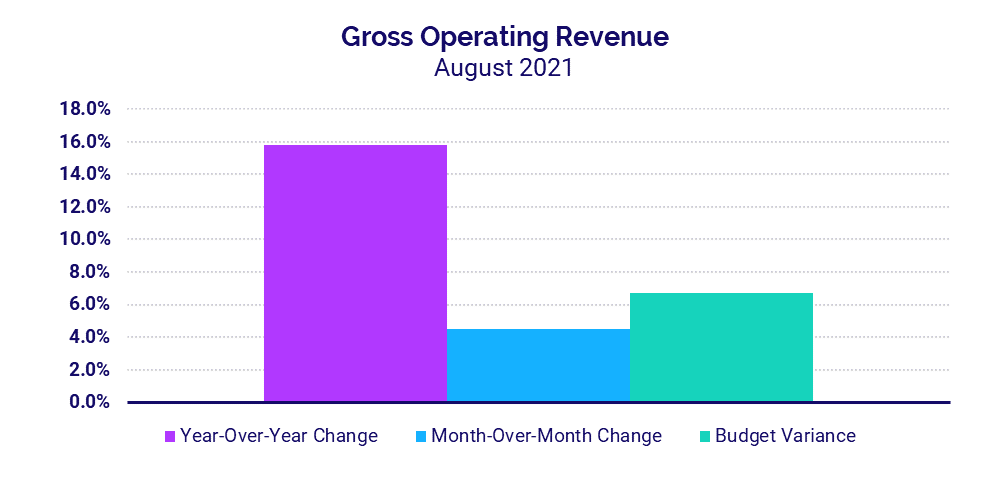
- Hospital Gross Operating Revenues increased 15.8% compared to August 2020
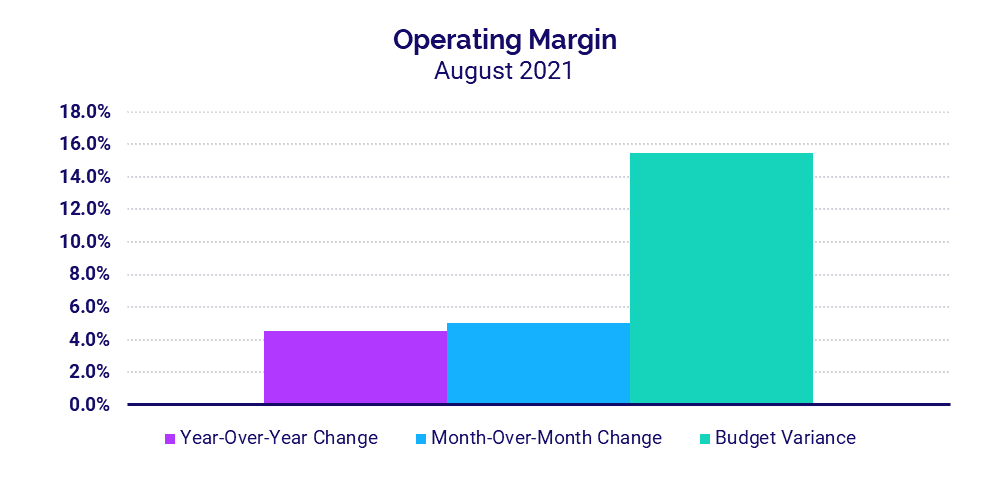
- Hospital Operating Margins increased 4.5% over the same period last year
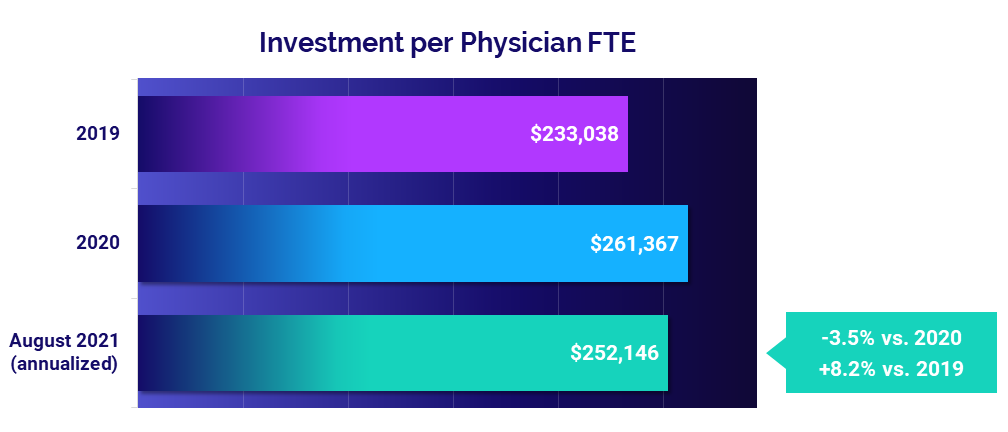
- Investment per Physician FTE fell -3.5% below 2020 levels
Steve Wasson
EVP and GM, Data and Intelligence Solutions
Syntellis Performance Solutions
Market Analysis
A rise in COVID-19 cases and hospitalizations throughout August drove continued sharp increases in hospital intensive care unit (ICU) volumes and staffing. Pediatric ICUs, in particular, saw dramatic increases in volumes as the highly infectious Delta variant contributes to higher levels of child hospitalizations than other variants of the COVID-19 virus.
Key market analysis metrics from August 2021 compared to pre-pandemic levels in August 2019 include:
- Pediatric ICU Patient Days: +35%
- Medical ICU Patient Days: +19%
- Medical ICU Patient Days in the South: +34%
- ICU Overtime percentage in the South: +4.1%
Delta variant continues to batter pediatric ICUs
Pediatric ICU volumes surged in July and August with the rapid spread of the Delta variant. Compared to 2019 levels, pediatric ICU Patient Days jumped 35% in August 2021.
Pediatric ICUs typically see seasonal fluctuations from the flu and other infectious diseases, as reflected in the winter 2019 uptick in volumes shown in the chart. This usual seasonal trend did not occur last winter, likely due to COVID-19 social distancing precautions aimed at limiting transmission of the virus. The abnormal spike in pediatric ICU volumes in August could be a precursor to a more severe winter than prior to the pandemic as states have eased many of those precautions, and schools nationwide have shifted back to in-person learning.
The pediatric ICU volume increases led to increased staffing needs. Overtime percentages in pediatric ICUs rose 2% at the median in August versus August 2019, and as much as 3.4% for hospitals in the bottom quartile that experienced the most severe increases.
Medical ICUs see sustained increases
Adult Medical ICUs also saw sharp increases in Patient Days for a second consecutive month due to rising COVID-19 infections and hospitalizations spurred by the spread of the Delta variant. Compared to August 2019, Medical ICU Patient Days jumped 19% for the month at the median and as much as 52% for the hardest-hit hospitals. Looking back over the course of the pandemic, these increases are approaching a peak in Medical ICU Patient Days seen during last winter’s surge in December 2020.
Hospitals in the South and West see the greatest spikes
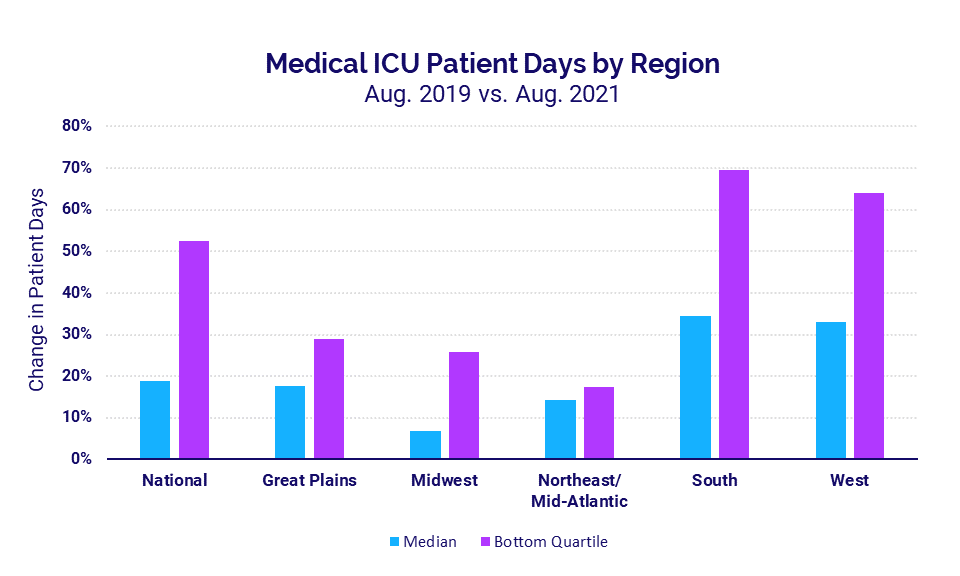
Hospitals in regions* with the highest rates of Delta infections experienced the most significant increases. Hospitals in the South saw Medical ICU Patient Days spike 34% in August compared to the same period in 2019 and 70% for the worst-hit hospitals. In the West, Medical ICU Patient Days rose 33% at the median and as much as 64% for hospitals in the bottom quartile.
The rise in Patient Days exacerbated overtime issues in Medical ICUs, especially in regions enduring the greatest increases. Nationally, the median overtime percentage rose 2.4% in August compared to August 2019 and as much as 5.7% for the worst-hit hospitals. At a regional level, median overtime percentages increased 4.7%, 4.1%, and 3.7% over the same period in the Great Plains, South, and West, respectively. Hospitals in the South had the largest overtime increase — 8.2% — among hospitals in the bottom quartile.
Hospital KPIs
August 2021
Rapid spread of the COVID-19 Delta variant drove up inpatient volumes as organizations cared for growing numbers of more severe, high-acuity patients. Increased demand contributed to higher revenues and margins for the month, but those increases were moderated by mounting expenses.
Here are the August 2021 financial KPIs for U.S. hospitals and health systems compared to August 2020:
- Patient Days: +12.4%
- Total Expenses: +11.1%
- Total Non-Labor Expenses: +11.4%
- Revenue: +15.8%
- Operating Margin: +4.5%
Inpatient volumes rise with COVID-19 surges
Patient Days rose 12.4% year-over-year and 4.1% month-over-month in August as hospitals nationwide saw more patients requiring inpatient care, including those experiencing more severe cases of COVID-19.
Hospitals in the South — where spread of the Delta variant was particularly high throughout the month — saw the greatest volume increases, with Patient Days up 20.3% year-over-year and 19.2% above budget expectations. Hospitals of all sizes nationwide saw Patient Days rise above budget and above August 2020 levels, but the increases were more pronounced in smaller hospitals with fewer than 100 beds.
Expenses continue to escalate with rising care costs
Total Expenses rose 11.1% in August compared to the same period in 2020. Higher drug and supply expenses were major contributors. Drug Expenses jumped 41.7%, and Supply Expenses increased 25.1%, driving Total Non-Labor Expense up 11.4% year-over-year.
Hospitals in regions hardest hit by the Delta variant saw the biggest increases. Total Expense per Adjusted Discharge jumped 17.4% year-over-year and 18.7% above budget in the South and 8.1% year-over-year and 12% above budget in the West. Nationwide, smaller hospitals had the greatest increases with Total Expense per Adjusted Discharge up more than 11.6% relative to August 2020 for hospitals with less than 100 beds.
Revenues continue to increase
Gross Operating Revenue increased 15.8% in August compared to August 2020 due to rising patient volumes, with Inpatient Revenue up 14.7% and Outpatient Revenue up 16% year-over-year.
Net Patient Service Revenue (NPSR) per Adjusted Discharge rose year-over-year and above budget for hospitals of all sizes and across all regions. Smaller hospitals with 26-99 beds and hospitals in the South had the biggest increases for the metric compared to August 2020, jumping 21.7% and 19%, respectively.
Margins rise as volumes grow
The median hospital Operating Margin — including federal funding from the Coronavirus Aid, Relief, and Economic Security (CARES) Act — increased 4.5% compared to August 2020, the sixth month of the pandemic. Operating Earnings Before Interest, Taxes, Depreciation, and Amortization (EBITDA) Margin, however, dropped -2.5% for the month compared to the same period last year with CARES, but rose 5.6% year-over-year without CARES.
Operating EBITDA Margins decreased year-over-year for hospitals in regions experiencing some of the greatest surges in COVID-19 cases from Delta, including the West (-8.7%), South (-14.1%), and Great Plains (-20.2%). Operating EBITDA Margins dropped for larger hospitals versus August 2020, but increased more than 4% year-over-year for smaller hospitals with less than 200 beds.
Physician Practice KPIs
August 2021
Employed physicians across the country continued to see increases in productivity in August as more patients sought care, leading to higher physician revenues coupled with higher expenses. Although the investments needed to offset inadequate physician revenues fell compared to the same period in 2020, they remain above pre-pandemic levels, reflecting a need for continued focus on physician practice performance improvements.
The top five financial and operational KPIs from annualized August 2021 data compared to 2020 for physician practices nationwide are:
- Physician Productivity: +14.1%
- Revenue: +11.6%
- Total Direct Expense: +7.5%
- Investment: -3.5%
- Support Staff: -7.7%
Physician productivity nears pre-pandemic performance
Physician productivity followed a similar pattern as the previous month. August annualized Physician work Relative Value Units (wRVUs) per Full-Time Equivalent (FTE) held close to pre-pandemic performance at just -1.3% below 2019 levels. Still, they rose 14.1% compared to depressed productivity driven by low practice volumes in 2020.
Obstetrics/Gynecology (Ob/Gyn) was the only specialty to see a slight improvement in physician productivity compared to before the pandemic, with Physician wRVUs per FTE up less than 1% from 2019. All other specialties saw August annualized productivity fall below 2019 levels, with Hospital-Based Specialties seeing the greatest drop at -15.5%.
Physician revenues reach 2019 levels as volumes rise
Net Revenue per Physician FTE was essentially in line with pre-pandemic levels in August on an annualized basis, up less than 1% compared to 2019 at $633,508. Compared to low revenues in 2020, however, Net Revenue per Physician FTE jumped 11.6%.
Revenues increased across all specialty cohorts from 2020 to August 2021 annualized, but fell below 2019 levels for four of five specialty cohorts. Medical Specialties were the only cohort to see Net Revenue per Physician FTE increase, rising 4.6% above 2019.
Expenses remain high as non-labor costs escalate
The median annualized Total Direct Expense per Physician FTE (including advanced practice providers) was $888,084 in August, up 2% compared to 2019 and up 7.5% from 2020. Physician practices in the South and West saw the biggest increases compared to 2020 at 10.8% and 12.3%, respectively.
Looking at different specialty cohorts, Medical Specialties had the biggest increases with Total Direct Expense per Physician FTE up 12.4% compared to 2020 and up 5.4% compared to 2019.
Physician investments remain above pre-pandemic levels
The median annualized Investment per Physician FTE required to supplement physician revenues continued to rise above 2019 levels, reaching $252,146 in August. That is up 8.2% from 2019 but improved compared to last year at -3.5% below 2020 levels.
Physician investments rose across all specialties compared to pre-pandemic levels, with Ob/Gyn seeing the biggest jump at 17.2%. Most specialties saw decreases from 2020, however, with the exception of Hospital-Based Specialties, which saw Investment per Physician FTE rise 4.5% compared to last year.
Staffing levels decrease as physician productivity increases
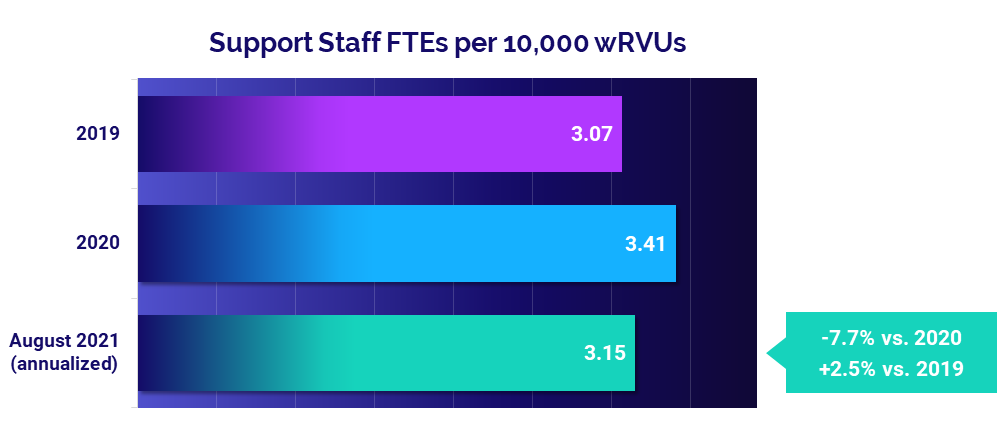
Support staff levels dropped compared to highs seen in the first year of the pandemic in 2020. August annualized Support Staff FTEs per 10,000 wRVUs fell -7.7% below 2020 levels, due in part to increasing physician productivity. Compared to before the pandemic in 2019, Support Staff FTEs per 10,000 wRVUs were up 2.5%.
Ob/Gyn and Primary Care both saw Support Staff FTEs per 10,000 wRVUs decrease compared to both 2019 and 2020, while Surgical and Medical Specialties increased relative to 2019 but were down from 2020.
The Road Ahead for Healthcare
The August 2021 key performance indicators and trends highlighted in this report provide insights into the sustained gravity of the COVID-19 pandemic for hospitals, health systems, and physician practices nationwide. The spikes in patient volumes and expenses driven by the latest two-month surge in cases from the highly contagious Delta variant further illustrate the volatility the virus has brought upon the industry.
The pace of infections appears to be lessening in recent weeks, but the future course of COVID-19 remains uncertain as we move into the cooler fall and winter months. Meanwhile, healthcare providers across the country are working to recover from the ongoing financial and operational challenges wrought by the virus over the past year and a half.
Healthcare leaders should consider how increased volumes affect staff, operations, and overall performance in ICUs, inpatient units, and other critical areas. Having sound operational and financial data and analytics capabilities is essential to helping your organization stay agile and navigate future fluctuations.
Source: Syntellis’ Axiom™ Comparative Analytics, which offers access to real-time data drawn from more than 135,000 physicians from over 10,000 practices and 139 specialty categories, and from 500+ unique departments across more than 1,000 hospitals. Powered by Syntellis IQ, Comparative Analytics also provides data and comparisons specific to a single organization for visibility into how their market is evolving.
*Regional data is broken down by states. The Northeast/Mid-Atlantic includes ME, VT, NH, MA, RI, CT, NY, PA, NJ, DE, MD, WV, and VA. The South includes FL, TX, LA, MS, AL, GA, SC, NC, OK, AR, TN, and KY. The Midwest includes WI, MI, IL, IN, and OH. The Great Plains includes ND, SD, NE, KS, MN, IA, and MO. The West includes CA, AZ, NM, NV, UT, CO, OR, ID, WY, WA, MT, AK, and HI.

