Executive Summary
The Initial Impacts of Delta on U.S. Hospitals and Physician Groups
U.S. hospitals, health systems, and physician groups felt the early impacts of the Delta variant in July. COVID-19 cases surged more than 500% from June 30 to July 31, with the highly contagious Delta variant making up 96% of overall cases by month’s end. As the prevalence of Delta swelled in parts of the country, patient days in intensive care units (ICUs) followed suit as hospitals worked to care for patients with more severe COVID-19 cases.
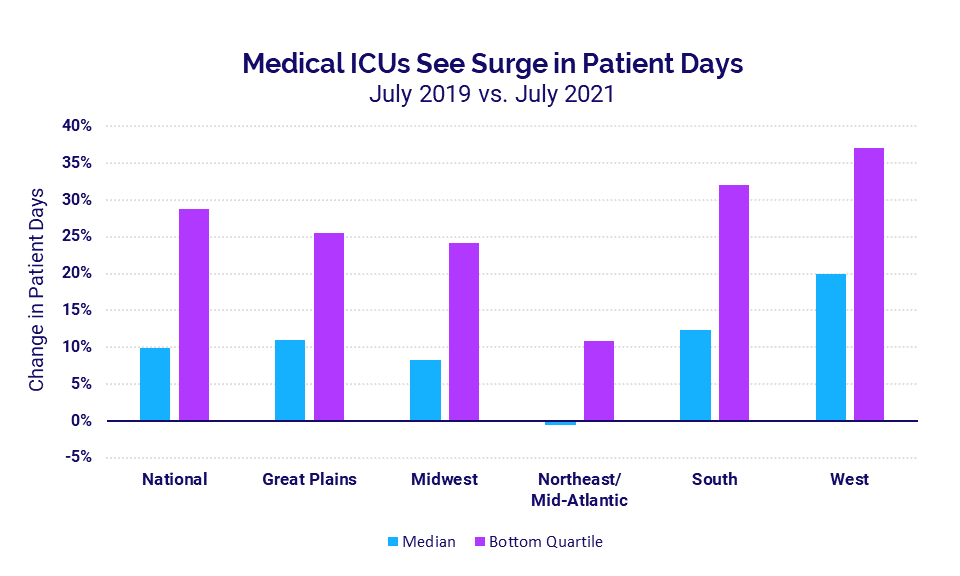
Compared to before the pandemic in July 2019, pediatric ICU patient days increased 16% and medical ICU patient days rose 9.9%. Hospitals in the South and West saw the biggest increases in median medical ICU patient days at 12.4% and 20%, respectively.
Volumes increased in other areas compared to July 2020 performance, but changes were less drastic versus July 2019. Emergency department (ED) visits, for example, recovered 14.2% compared to last year’s lows but were down -5% compared to July 2019. At the same time, hospital and health system expenses continued their relentless climb while margins narrowed.
Physician groups also experienced increased volumes, which contributed to higher physician productivity and compensation for the month compared to the same period last year. Physician revenues rose in July performing close to pre-pandemic levels. Yet unsustainable increases in investments and expenses signify continued instability for physician groups nationwide.
Other key findings include:
- Overtime percentages in medical ICUs rose alongside ICU patient day increases
- Imaging procedures rose year-over-year for a second consecutive month
To understand these and other trends in hospital and physician performance, Syntellis analyzed July 2021 data from more than 135,000 physicians and 1,000 hospitals.
Steve Wasson
EVP and GM, Data and Intelligence Solutions
Syntellis Performance Solutions
Hospital KPIs
July 2021
Hospitals and health systems across the country felt the early effects of the Delta variant full force in July as renewed increases in COVID-19 cases drove up volumes and expenses. Revenues also increased as a result, but those increases were offset by higher expenses resulting in tighter hospital margins.
Here are the YOY July 2021 financial KPIs for U.S. hospitals and health systems:
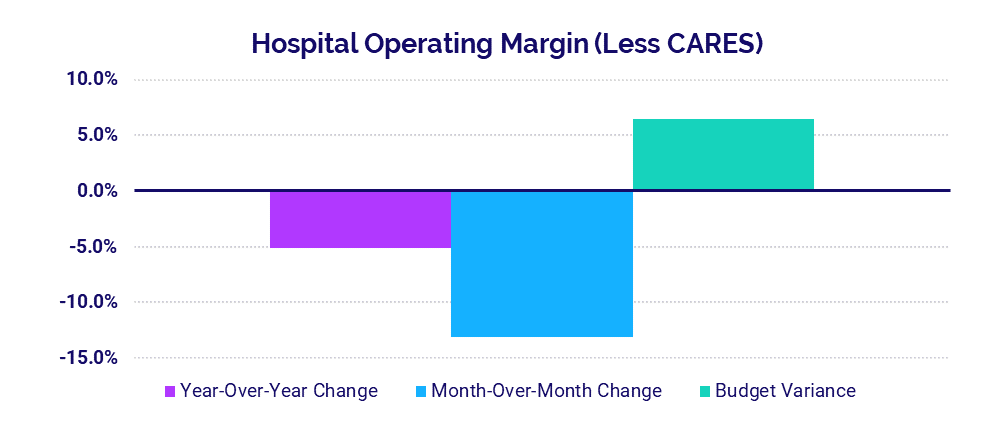
- Operating Margin without CARES Funding: -5.1%
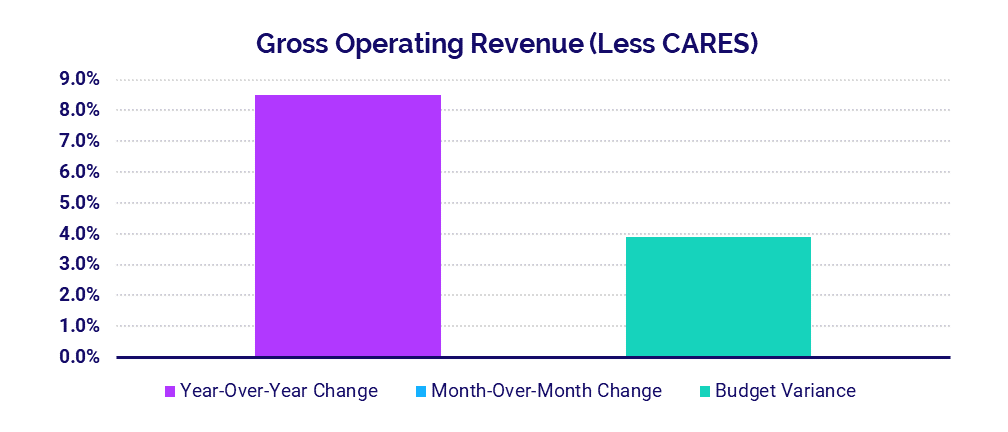
- Revenue: +8.5%
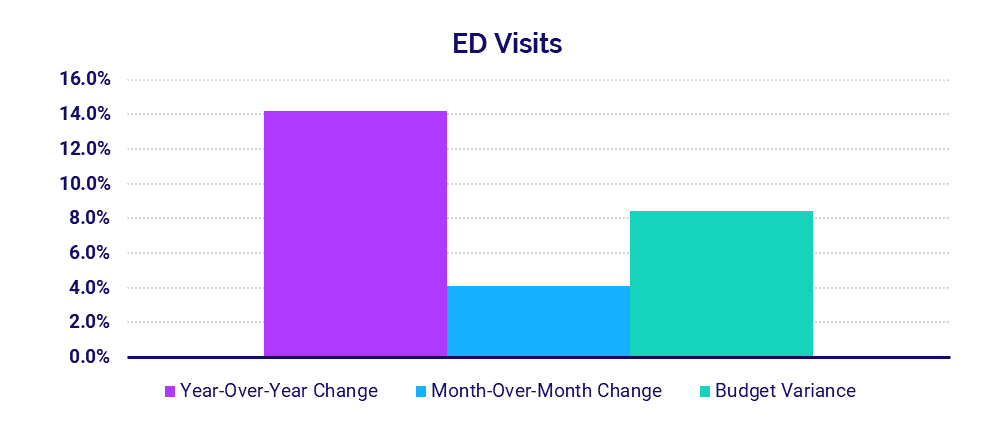
- ED Volume: +14.2%
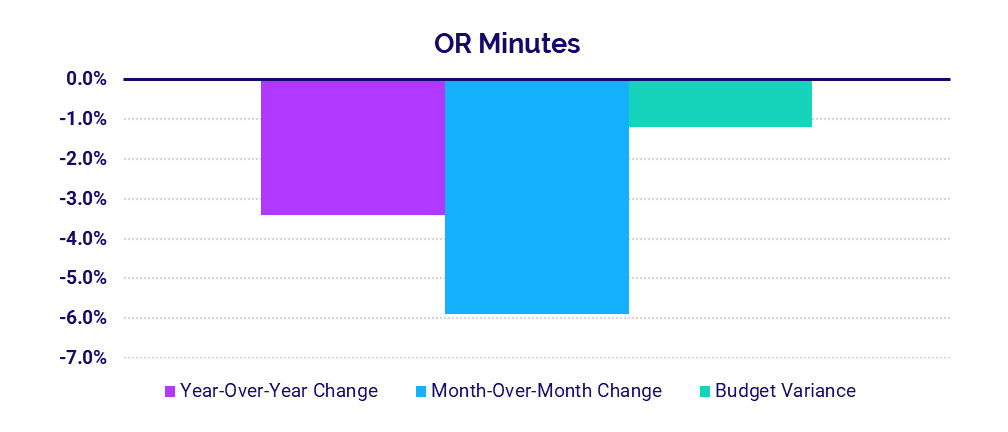
- OR Minutes: -3.4%
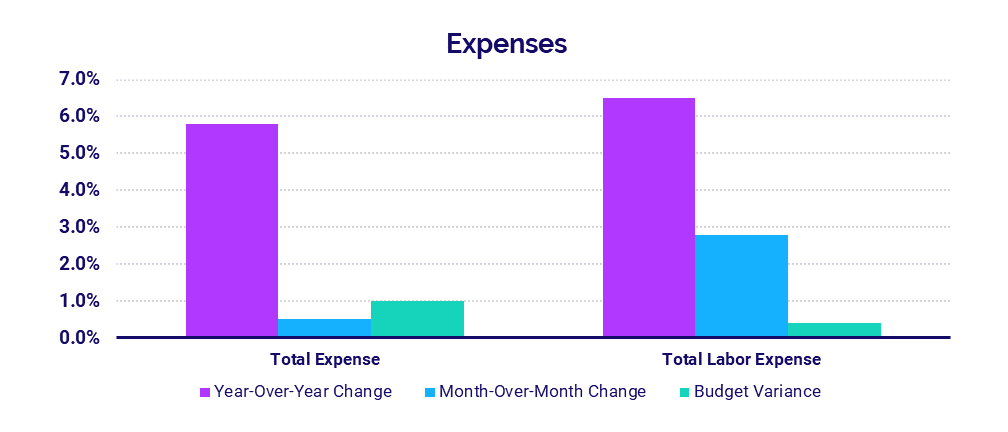
- Total Expenses: +5.8%
- Total Labor Expenses: +6.5%
Margins narrow as hospitals cope with the latest surges
The median hospital Operating Margin was down -13.1% in July compared to June 2021, not including federal funding from the Coronavirus Aid, Relief, and Economic Security (CARES) Act. Compared to July 2020, Operating Margin was down -5.1%.
The largest hospitals with 500 beds or more saw the biggest year-over-year increase in Operating Margin (not including CARES) at 56% and were 2.7% above budget. The smallest hospitals with 0-25 beds saw the largest variance to budget for the metric at 41.3% and were up 10.9% compared to July 2020.
Revenues rise with increased patient volumes
Gross Operating Revenue (not including federal CARES aid) rose 8.5% year-over-year in July but was flat month-over-month and 3.9% above budget. Inpatient (IP) and Outpatient (OP) Revenue both increased compared to July 2020 up 5.8% and 11.0%, respectively.
Gross Operating Revenue Less CARES was above budget and up 8% or more year-over-year for hospitals of all sizes. Hospitals with 500 beds or more had the biggest year-over-year increase at 11.2% while hospitals with 26-99 beds had the biggest variance to budget at 6.3%.
ED volumes rise above 2020 lows
Emergency Department (ED) Visits increased 14.2% in July compared to July 2020 and 4.1% compared to June 2021. Most regions saw ED Visits increase 8.7% or more year-over-year. The Great Plains was the outlier, with ED Visits down about -40% both year-over-year and compared to budget.
Nationally, Operating Room (OR) Minutes dropped -3.4% year-over-year and -5.9% month-over-month, indicating a drop in surgical cases coinciding with the rise in Delta. This suggests non-urgent procedures are once again being delayed to mitigate infection risks.
Expenses continue to climb as hospitals take on more COVID-19 care costs
Total expenses rose across the board as the nation’s hospitals continued to bear the costs of care for high-acuity patients, including growing numbers of COVID-19 cases. Total Expense rose 5.8% year-over-year while Total Expense per Adjusted Discharge was relatively stable, decreasing just -0.7% compared to July 2020.
With the increased volumes, hospitals saw Labor Expense increase 6.5% and Non-Labor Expense increase 5.3% compared to last year. Labor Expense per Adjusted Discharge was up the most for 0-25 bed hospitals by 8.6% and fell the most for 300-499 bed hospitals by -3.3%.
Physician Practice KPIs
July 2021
U.S. physician practices saw volumes continue to climb in July, contributing to greater physician productivity, revenues, and compensation as well as higher expenses. Continued expense increases could lead to higher levels of investments, threatening the long-term viability of many practices nationwide.
Here are the top five financial and operational KPIs from July 2021 (YTD annualized), compared to 2020, for physician practices across the U.S:
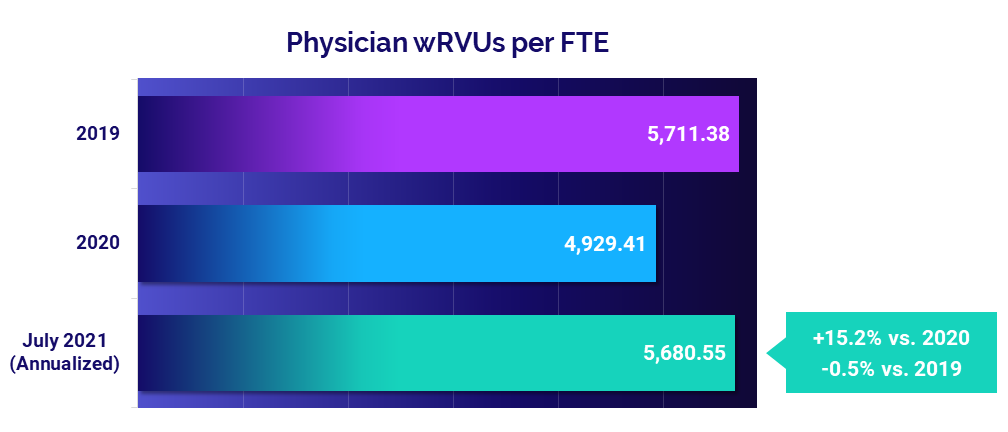
- Productivity: +15.2%
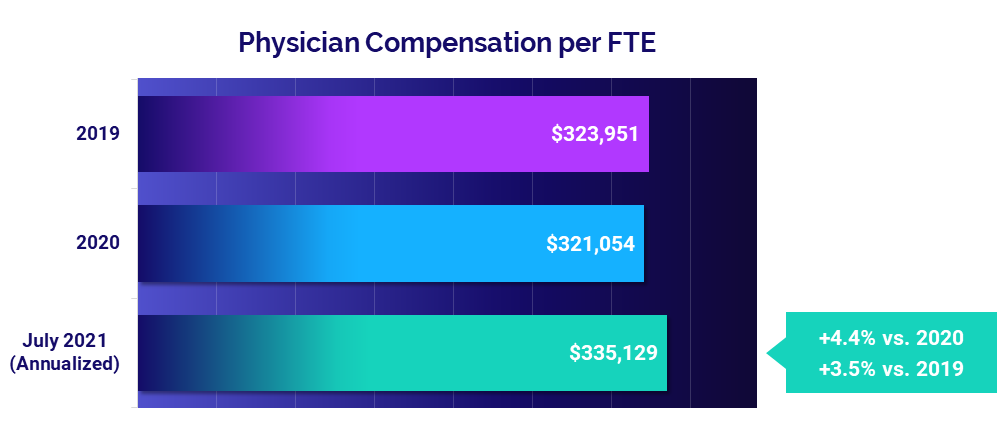
- Compensation: +4.4%
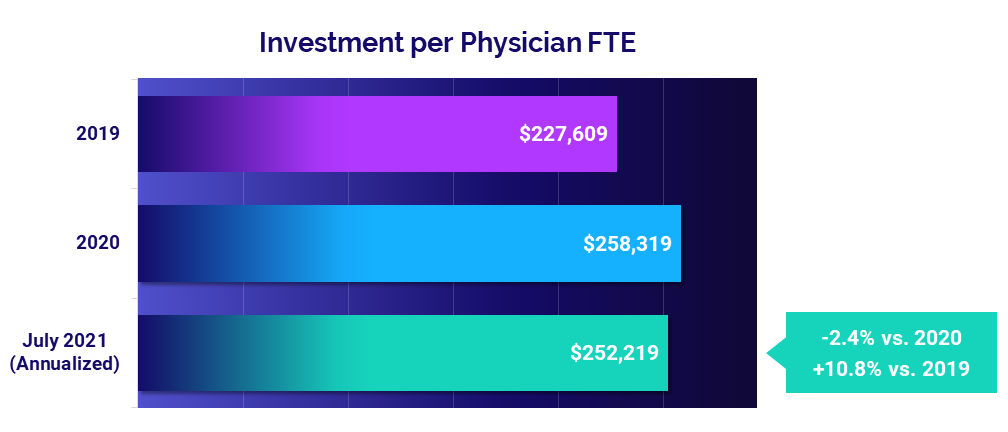
- Investment: -2.4%
- Total Direct Expense: +9.1%
- Revenue: +11.6%
Physician productivity jumps versus 2020, falls close to pre-pandemic levels
Physician productivity was close to pre-pandemic performance in July, with Physician work Relative Value Units (wRVUs) per Full-Time Equivalent (FTE) falling just -0.5% below 2019 levels. Compared to 2020 performance, however, median Physician wRVUs per FTE were up 15.2% (year-to-date annualized). The large jump reflects a resurgence in patient volumes compared to 2020, when physician visits dropped dramatically due to COVID-19 concerns and mitigation efforts.
Obstetrics/Gynecology (Ob/Gyn) and Medical specialties were the only specialties to see improved productivity relative to 2019 at 4.2% and 2.4%, respectively. Hospital-based specialties saw the biggest decrease with Physician wRVUs per FTE falling -10.1% compared to 2019.
Compensation increases as physician productivity increases
Recent increases in physician productivity contributed to an increase in physician compensation for July. Physician Compensation per FTE rose 3.5% above pre-pandemic 2019 performance and 4.4% compared to 2020.
Ob/Gyn had the biggest increases for this metric versus other specialty cohorts, rising 7.8% relative to 2019 and up 6% from 2020. Surgical Specialties had the smallest increase versus 2019 at 1.7% but were up 4.5% compared to a dip seen in 2020.
Physician investments continue to rise above pre-pandemic levels
The Investment per Physician FTE needed to supplement physician revenues jumped 10.8% compared to pre-pandemic 2019 levels for a median of $252,219 on a year-to-date annualized basis for July. The metric improved slightly compared to 2020 levels, falling -2.4%.
All specialties saw investment increases compared to 2019. Investment per Physician FTE rose 20% or more versus 2019 for two specialty cohorts: Surgical (20%) and Ob/Gyn (24.8%). Compared to 2020, Primary Care saw the biggest decrease at -9%.
Mounting expenses pose long-term challenges
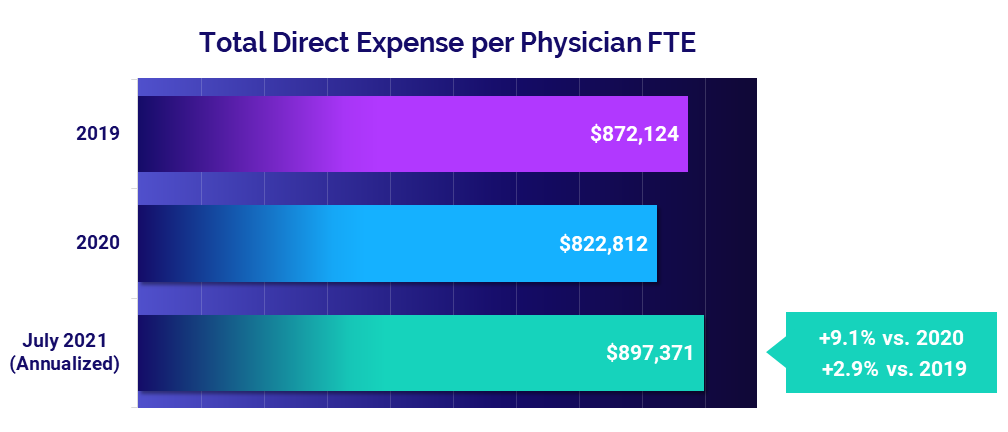
The median Total Direct Expense per Physician FTE was $897,371 in July (annualized). That is up 2.9% compared to before the pandemic in 2019 and up 9.1% from 2020. Most specialty cohorts saw expenses increase in July 2021 compared to both 2019 and 2020.
Medical Specialties had the biggest increase compared to 2020 at 12.3%. Primary Care was the only specialty to see a decrease, with Total Direct Expense per Physician FTE falling -0.5% relative to 2019 but rising 6.4% versus 2020.
Increased volumes contribute to higher physician revenues
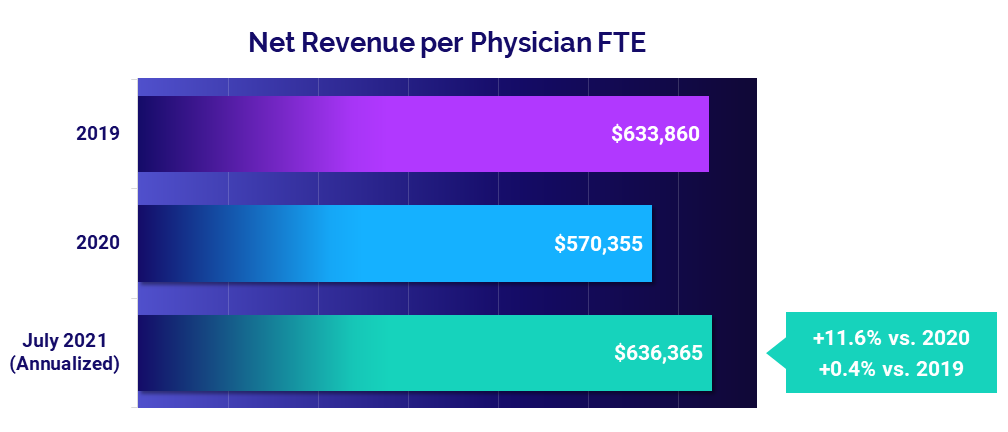
The median Net Revenue per Physician FTE was close to pre-pandemic levels at $636,365 annualized in July. That is up just 0.4% compared to 2019 but up 11.6% following significant revenue declines in 2020.
Revenues increased across all specialty cohorts from 2020 to 2021 and rose across three of six specialty cohorts from 2019 to 2021. Surgical Specialties had the biggest drop relative to 2019 at -7.3%.
Market Analysis
Deeper analysis of hospital performance in July further illustrates the repercussions of Delta’s spread. Hospital ICUs saw volume and overtime increases as they worked to care for growing numbers of COVID-19 patients. Imaging procedures also increased for a second consecutive month compared to last year’s lows.
Key market analysis metrics from July include:
- Medical ICU Patient Days: +9.9%
- Pediatric ICU Patient Days: +16%
- ICU Overtime percentage in the South: +1.3%
- Imaging Gross Revenue per Procedure: +2% to +7%
Delta causes volumes to surge in medical and pediatric ICUs
Compared to pre-pandemic levels in 2019, ICU Patient Days rose dramatically in July in conjunction with steep increases in COVID-19 cases from the highly contagious Delta variant. Nationally, pediatric ICUs saw a 16% increase and medical ICUs saw a 9.9% increase for the month compared to July 2019.
ICUs in the South and West were the hardest hit with the largest median increases in medical ICU patient days of 12.4% and 20%, respectively. Medical ICUs that fell into the bottom quartile — meaning they had the most severe increases — saw patient days jump as much as 32% in the South and 37% in the West.
The Northeast/Mid-Atlantic was the only region to see a slight median decrease of -0.5% in medical ICU patient days compared to July 2019, indicating the region has yet to feel the full impacts of the variant. Due to the localized nature of Delta variant surges, certain cities or counties within a region may be hit especially hard while the region as a whole fares better.
Higher ICU volumes drive staff overtime increases
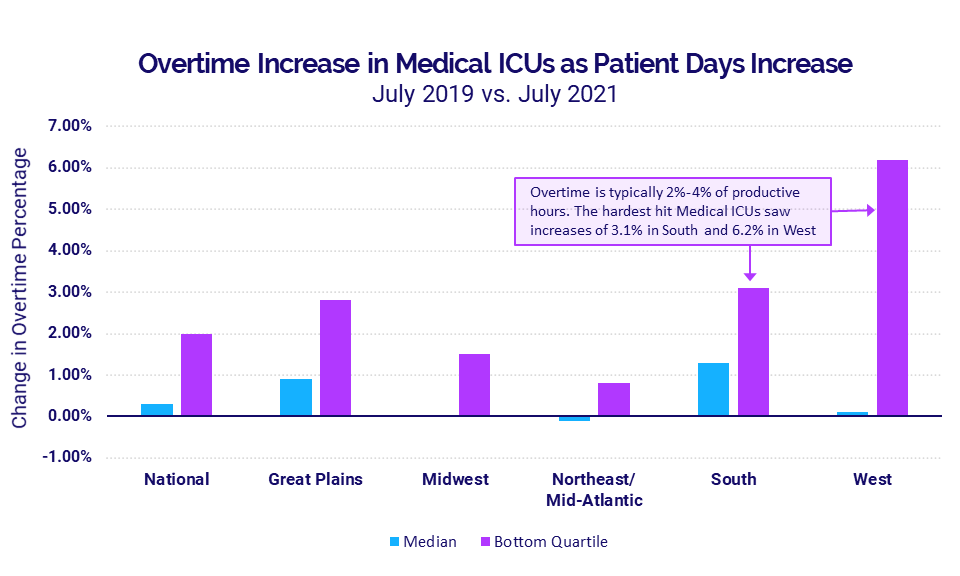
Overtime percentages in medical ICUs rose in July as patient days rose and more personnel were needed to care for high acuity COVID-19 patients.
While the median national overtime increase in medical ICUs was just 0.3% compared to July 2019, hospitals in the hard-hit South saw a median overtime percentage increase of 1.3% and as much as 3.1% for the worst-hit hospitals. In the West, the median overtime percentage increased just 0.1% but the bottom quartile of medical ICUs saw a 6.2% increase.
A normal overtime range in nursing departments typically is from 2% to 4%. For those hospitals in the West, that means a medical ICU increase of 6.2% would drive a 4% overtime rate up to 10.2%. If these trends continue, sustained overtime increases will take a toll on healthcare workers at high costs for hospitals.
Imaging procedures increase for a second consecutive month
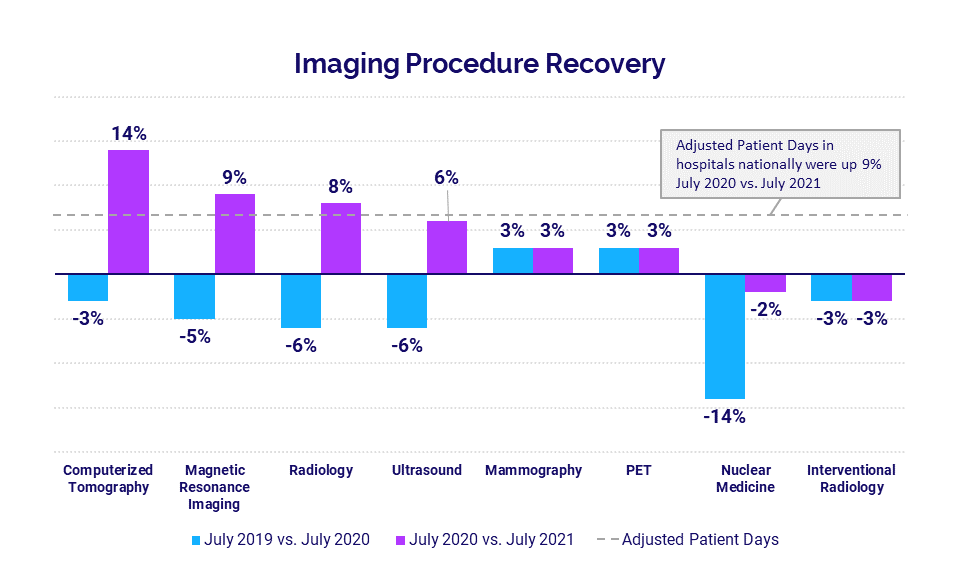
Imaging procedures rose year-over-year in July for the second month in a row. Although most imaging procedures for the month did not outpace the increase in hospital Adjusted Patient Days, all imaging departments saw a 2%-7% increase in gross revenue per procedure.
Nuclear medicine and interventional radiology were the only departments to see a year-over-year decline in imaging procedures. Computerized tomography saw the biggest increase, jumping 14% compared to July 2020.
The Road Ahead for Healthcare
July 2021 data illustrates the continued financial and operational impacts of the pandemic on the nation’s hospitals, health systems, and physician practices. As COVID-19 cases continue to surge throughout the U.S. once again, many organizations are experiencing significant setbacks after months of hard-fought progress to recover from last winter’s surges.
In addition to the financial pains, the overtime increases provide a glimpse of the ongoing strains for a healthcare workforce already stretched thin after more than 16 months of the pandemic. Further spread of the Delta variant likely will contribute to continued volume increases, rising expenses, higher physician investments, and narrowing margins in the months ahead. Healthcare leaders must keep a close eye on the impacts to their bottom line. This may require embracing and planning around yet another new normal as the situation continues to evolve.
For an in-depth understanding of the changes to healthcare’s financial landscape, leaders need reliable data to track KPIs in real time, identify opportunities for improvement, and effectively guide recovery efforts. Only then can the nation’s hospitals, health systems, and physician practices position themselves to make informed planning decisions to ensure exceptional patient care and long-term financial sustainability.
Source: Syntellis’ Axiom™ Comparative Analytics, which offers access to real-time data drawn from more than 135,000 physicians from over 10,000 practices and 139 specialty categories, and from 500+ unique departments across more than 1,000 hospitals. Powered by Syntellis IQ, Comparative Analytics also provides data and comparisons specific to a single organization for visibility into how their market is evolving.
Read more of our latest hospital and physician KPI data:

Market Analysis and Monthly Hospital & Physician KPIs: October 2023

Market Analysis and Monthly Hospital & Physician KPIs: September 2023
