Financial performance across U.S. hospitals remained volatile in July 2020. Hospitals saw flat year-over-year gross revenue performance, continued high per-patient expenses, and a fifth consecutive month of volumes falling below 2019 performance and below budget across most metrics.
With fewer patients coming in and expenses continuing to climb per patient, it’s hard to know what the future holds. Will expenses keep rising? Are patients delaying care? Are patients seeking care in ambulatory settings? Do modest month-over-month gains from June to July indicate the beginnings of a recovery?
We’ll continue monitoring data and share what we learn. Here are the July 2020 financial key performance indicators (KPIs) for hospitals and health systems:
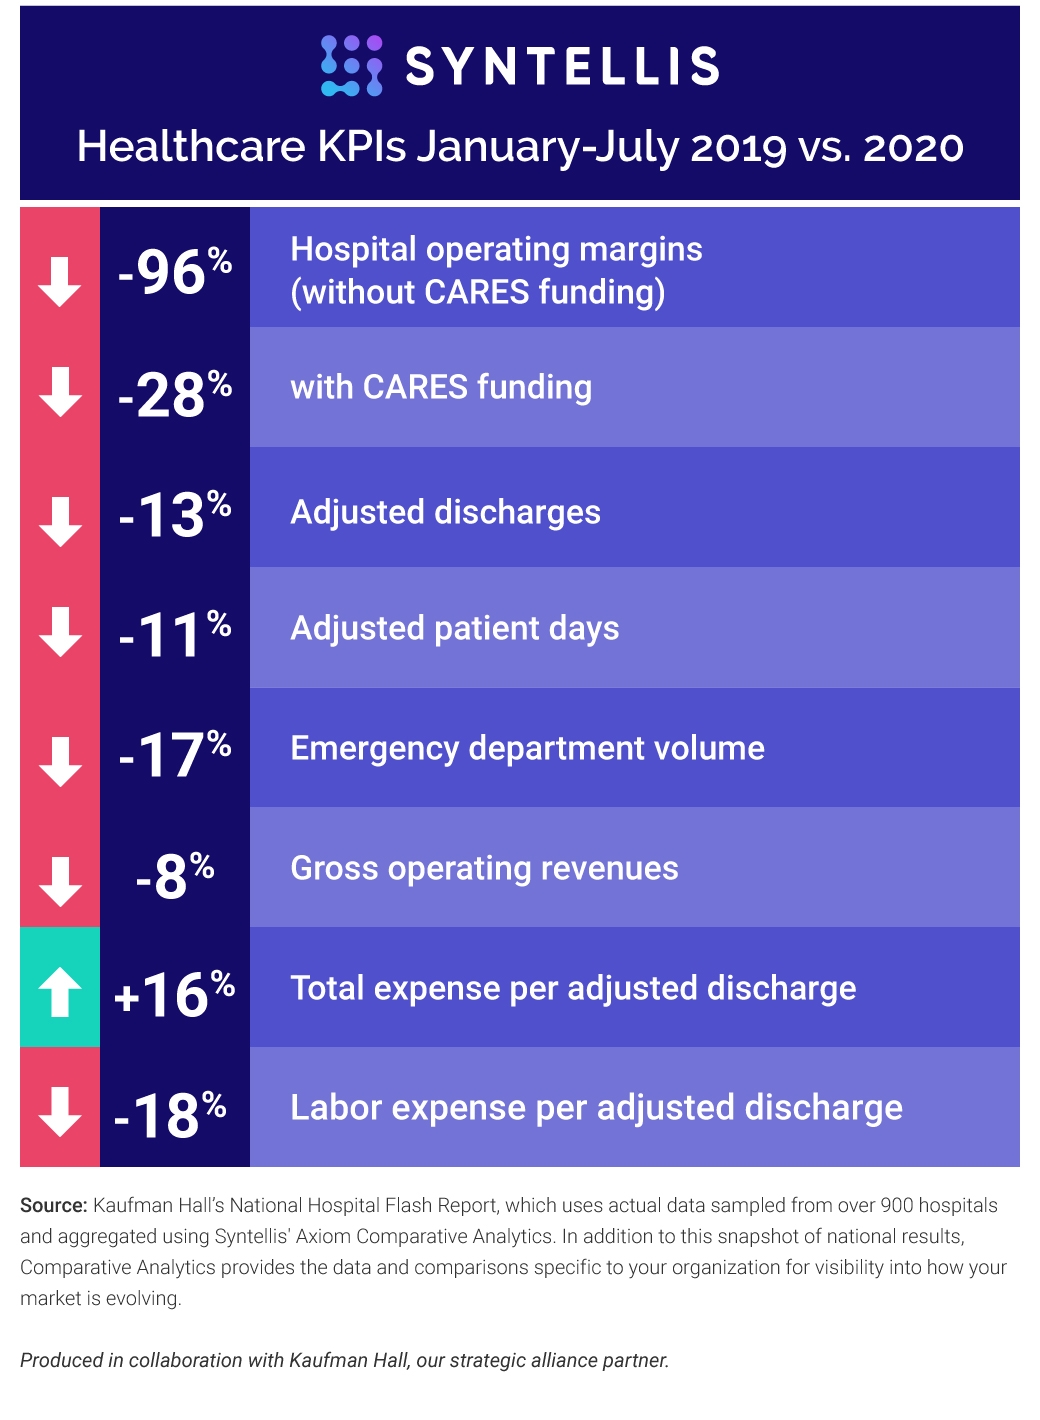
- 2020 Hospital operating margins remain very low, even with CARES funding
Compared to January-July 2019, 2020 hospital Operating Margins plummeted 96%, not including federal CARES funding. With the funding, Operating Margins are down 28% year-over-year. - July operating margins made some gains compared to June
July Operating Margins declined 2% year-over-year but increased 24% from last month. Additional good news is July was 15% above budget without CARES funding. - Patient volumes are slowly recovering but remain well below 2019 levels
Discharges and Adjusted Discharges were down 7% year-over-year, yet increased 6% from June. Adjusted Discharges dropped 13% year-to-date and Adjusted Patient Days dropped 11%. - Hospital revenue remains low
Gross Operating Revenues have fallen 8% year-to-date, while Inpatient Revenue is down 5% and Outpatient Revenue is down 11%, not including federal aid. - Hospital expenses are increasing even as hospitals see fewer patients
Hospitals have seen Total Expense per Adjusted Discharge jump 16%, Labor Expense per Adjusted Discharge jump 18%, and Non-Labor Expense per Adjusted Discharge jump 15% from January-July 2020.
Monthly Spotlight: Emergency Department
Emergency Department (ED) volumes have seen deeper, longer lasting impacts than other departments, falling 17% compared to January-July 2019, and 13% below budget in July. This marks the fifth-straight month of double-digit year-over-year declines in ED visits for hospitals nationwide. However, ED visits showed some gains compared to June, rising 10% month-over-month.
Turning Data into Action
It’s easy to see that healthcare organizations have struggled since the beginning of the pandemic, but understanding how your performance compares to national and regional averages can help determine where you might focus efforts to improve performance.
For example, consider how your organization’s performance relates to this data: Is your Total Expense per Adjusted Discharge higher than the national average? If so, you might be overlooking cost-savings techniques that have proven successful in other organizations.
Syntellis’ Axiom™ Comparative Analytics software drives real-time operational decisions and performance improvement initiatives by providing performance insights, helping healthcare leaders objectively compare their organization to regional peers, and identifying opportunities to reduce costs and maximize revenue. With easy access dashboards that highlight specific areas of your operation that are the best candidates for cost reductions based on your budget and your peers, you can dive deeper into KPIs to see how your organization’s performance compares. Learn more.
Source: Kaufman Hall’s National Hospital Flash Report, which uses actual data sampled from over 900 hospitals and aggregated using Syntellis' Axiom Comparative Analytics. In addition to this snapshot of national results, Comparative Analytics provides the data and comparisons specific to your organization for visibility into how your market is evolving.
Produced in collaboration with Kaufman Hall, our strategic alliance partner.


