
Top 5 Healthcare Finance KPIs: May 2021
Recovery slowly gains traction
Recent gains bode well for recovery among the nation’s hospitals and health systems, but a return to normalcy still remains elusive. Patient volumes and margins continue to improve against 2020 performance, but both metrics remain lower than in May 2019. Although expenses are down from 2020 — yet higher than 2019 pre-pandemic levels — revenue continues to increase compared to the same month in the past two years.
Here are the May 2021 financial KPIs for U.S. hospitals and health systems:
#1 — Operating Margins improve
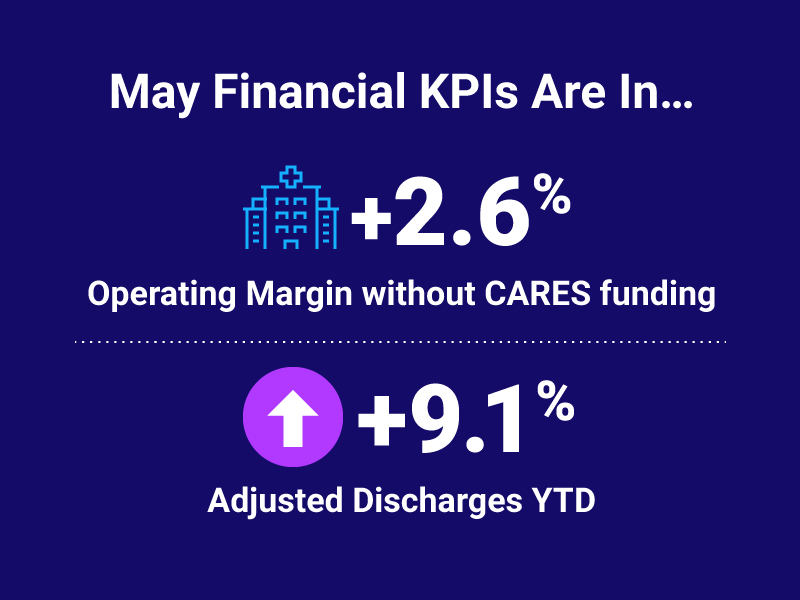
Median Operating Margin in May was 2.6% without CARES funding and 3.5% with CARES — a continued improvement that reflects increases in patient volumes and, especially, outpatient volumes. In April, Median Operating Margin was 2.4% without CARES funding and 3.3% with CARES.
#2 — Adjusted Discharges higher
Adjusted Discharges rose 9.1% year-to-date (YTD) compared to 2020 but fell 7.1% YTD compared to the first five months of 2019. Increasing patient volumes contributed to the year-over-year (YOY) increase.
#3 — OR Minutes exceed pre-pandemic level
Operating Room Minutes were 28.3% higher YTD and 0.8% higher than 2019 YTD numbers, demonstrating a pent-up demand for surgeries.
#4 — Revenues increase vs. 2019
Inpatient Revenue grew 13.1% YTD versus 2020 and 2.9% against 2019 TYD numbers. Outpatient Revenue showed much higher demand for ambulatory services, jumping 25.1% YTD against 2020 and 6.8% higher than YTD 2019.
#5 — Expenses also rise
Expenses were down compared to 2020 but higher than 2019 figures. Total Expense per Adjusted Discharge fell 1.7% YTD compared to 2020 but rose 16.6% against 2019 YTD numbers. Likewise, Labor Expense per Adjusted Discharge dropped 1.8% YTD against 2020 but rose 16.9% YTD compared to 2019.
Monthly Spotlight: Operating Margin
Not including CARES funding, Operating Margin jumped 95.2% YTD and Operating EBITDA Margin rose 95.2% compared to the first five months of 2020. However, compared to 2019 YTD numbers, Operating Margin dropped 20.5% YTD without CARES and Operating EBITDA Margin fell 16.7%. These numbers show that hospitals and health systems remain in the middle of their recovery efforts.
Turning Data into Action
Hospitals and health systems have reason for optimism as inpatient and outpatient revenues continue to rise against anemic 2020 performance are are higher than pre-pandemic 2019 numbers YOY. However, that optimism should be tempered by the realization that YOY labor and non-labor costs also are higher than 2020 and 2019.
Since labor represents 60% of overall expenses for hospitals and health systems, managing labor expense presents one of the biggest opportunities to reduce overall costs. Axiom™ Productivity Reporting, part of Axiom™ Performance Reporting, helps align labor utilization to workload demand, identifying the difference between current and target productivity goals and delivering actionable insights into productivity measures by department or across areas of responsibility.
As hospitals and health systems continue to recover from the devastating financial effects of the pandemic, they must better understand their cost structure related to peer organizations and other departments — down to specific physicians. Internal and external comparative data gives leaders a full financial picture of practice metrics.
In addition to aggregating data from more than 1,000 hospitals to analyze these KPIs, Axiom™ Comparative Analytics incorporates comparison data from 125,000 physicians across 10,000+ practice departments, so healthcare leaders can measure performance in a variety of dimensions, including investment and net revenue per physician FTE, practice financials, specialty, and geography. Available data includes provider compensation and productivity by named physician and support staff analysis by named APP.

Read more on hospital finance KPIs

Top 10 Financial and Operational Metric Areas for Healthcare

Top 5 Healthcare Finance KPIs: April 2021
