One of the biggest cost drivers in healthcare is inappropriate clinical variation. For organizations that can no longer cut their way to covering operation losses, addressing the overuse and underuse of resources and services is one of the few options left.
By eliminating unwarranted clinical variation, providers ensure that patients receive safe, high-quality care in an environment that strives to control resource consumption and patient throughput to reduce the overall cost of care.
Control charts provide physicians and executive teams with data-driven evidence to identify and improve variation. Read the article to learn:
- How control charts work
- The best ways to get started
- Common mistakes to avoid
No further debate is needed to confirm that unwarranted variation in clinical systems of care is one of the largest drivers of excessive healthcare costs in the USA, and one that can lead to suboptimal patient outcomes. The Institute of Medicine reports that one-third of healthcare spending does nothing to improve the quality of care delivered. Using 2009 figures, this translates into $210 billion in excess costs from unnecessary services, $130 billion from inefficiently delivered services, $210 billion from excess administrative costs, $105 billion from prices that are too high, $55 billion from missed prevention opportunities and $75 billion from fraud. US healthcare industry spending is 52 percent more as a percentage of gross domestic product and 45 percent more per capita than in the next highest-spending Westernized economy.
For organizations that can no longer cut their way to covering operating losses, addressing inappropriate clinical variation — meaning the overuse and underuse of resources and services — is one of the few options available after traditional cost transformation initiatives have been undertaken. By eliminating unwarranted clinical variation, providers ensure that patients receive safe, high-quality care in an environment that strives to control resource consumption and patient throughput to reduce the overall cost of care.
The call to action to address variation as an important component of overall clinical improvement and cost-reduction efforts is now urgent. Payers are continuing to shift from systems that reward volume to value-based business models that focus on outcomes and the total cost of care. With greater responsibility for costs and outcomes in these new payment models, providers must shift their focus to internal processes and care redesign to achieve reductions in mortality, length of stay, complication rates, avoidable admissions and readmissions, and other clinical indicators.
Progress Not Aligned With Urgency
Despite these pressures and changing market conditions, many hospitals and systems have been slow to respond. A 2018 Kaufman Hall survey revealed that fewer than 40 percent of healthcare providers are addressing clinical variation as part of their performance improvement initiatives. One of the most frequently cited obstacles to reducing clinical variation has been access to and use of appropriate analytical tools, such as statistical process control charts, that enable data-driven decision making.
When consistent and timely clinical reporting using reliable data is in place, care teams, including physicians, can be persuaded to follow clinical protocols and pay attention to how their performance stacks up against national benchmarks and peers. Executive teams receiving reports with compelling evidence that demonstrates the value of standardized care practices, in terms of both patient outcomes and financial impact, are more likely to support continued reduction of unwarranted clinical variation and push for accountability among stakeholders.
Data-driven decision making in the healthcare environment has several essential characteristics:
- Cost and quality transparency at the system and patient levels
- Comparative physician-level data with severity and risk adjustments
- Trending over time using national and internal benchmarks
- Actionable corrections
- Statistically significant reports that graphically illustrate variations and signal the need for change
A Tool From The 1920s Relevant In Data-Driven Environments
Delivering the right care at the right time and location, and for the right cost, is the underlying mission of US healthcare providers. Underperformance on important clinical performance measures, growing operating losses, and declining patient experience and outcomes signal that variances have occurred, which compromise this mission. The same can be said for business processes such as manufacturing. Producing the right product at the right time and location, and for the right cost, is the bedrock of successful manufacturing. When variability is reduced, improved quality and manufacturing efficiency occur, and economic value is achieved.
Given these similarities in goals, it is not surprising that a tool developed to streamline manufacturing methods in the 1920s by using statistical process control (SPC) methods is gaining traction in healthcare, where poor outcomes and inefficiencies are the result of variations. SPC’s strength is graphical presentation of data over time in control charts that enable decision makers to quickly gain insight into complex processes and better understand what the data are communicating about the root causes of failure and improvement opportunities. With software systems growing in their ability to aggregate and analyze clinical performance data, control charts are emerging as a superior tool for engaging clinicians in improvement discussions, prompting real-time correction and measuring the effectiveness of those corrections.
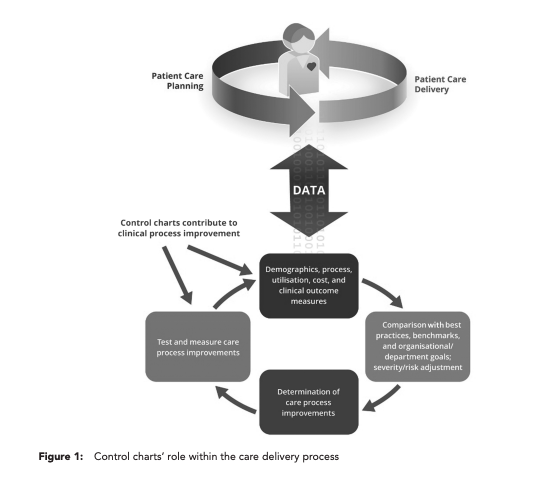
For example, total knee arthroplasty is currently one of the highest-volume and highest-cost clinical cohorts. Unwarranted variation documented in control charts that track length of stay for total knee arthroplasty can help identify the source of millions of dollars in excess cost annually for a hospital. The charts can then be used to facilitate discussions with physicians and care teams that are grounded in risk-adjusted, physician-specific analytics, which remove biases about patient complexity and focus attention on applying higher standards for cost-effective patient care, as shown in Figure 1.
Anatomy Of A Control Chart
At the most basic level, control charts document, over time, whether a process variation is consistent, in control or unpredictable, indicating that a deviation has been identified. Statistics such as rates, proportions and averages can be plotted and evaluated with control charts.
It is important to keep in mind that clinical care processes will always show some degree of variation that is considered normal and appropriate, while other variations signal that quality and efficiency are being compromised. These variations can be categorized into three specific types. Common cause variations occur as a result of something inherent in the process. If only common cause variation is observed, the process is considered to be stable and predictable. Special cause variations occur when an identifiable cause outside of the process is observed and could be eliminated with corrective action. If one or more patterns are evident on the chart, then special cause variation is present and making the process unstable or unpredictable. Because the source of special cause variation can be identified, action can be taken to eliminate the cause or keep it from reoccurring. Weather events are considered external variations, but they are not assigned to a cause that hospitals can correct. Together, these three types of variations must be measured, evaluated and understood in order to draw conclusions about care protocol changes that will contribute to the clinical and financial improvements being sought.
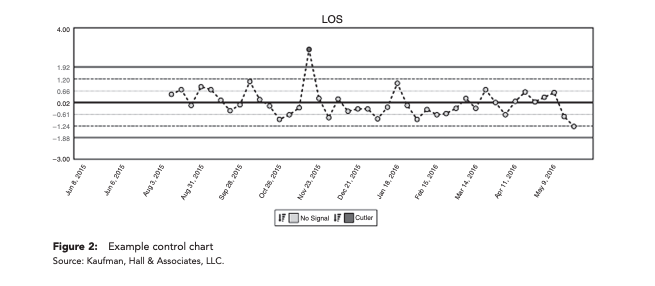
Control charts consist of several elements, as illustrated in Figure 2:
- Center lines represent calculations, usually as the mean, and illustrate the central tendency of the process.
- Upper and lower control limits appear above and below the center line and represent an estimate of the typical range of variation, which is calculated at the empirical standard deviation.
- Dots represent a data point and appear on the chart in chronological order. Any dots outside of the control limits may indicate that a process change has occurred that represents quality improvement or deterioration, depending on which control limit is crossed.
Three types of control charts can assist hospitals with examining special cause variations such as length of stay, process turnaround time, patient satisfaction, wait time and severity of medication errors.4 The decision about which chart to use is driven largely by the type of data being examined, as shown in Figure 3. If a single measure, such as turnaround time for a laboratory test, is being examined, then the XmR control chart is the appropriate choice. If the data point is composed of a set of data that includes more than one point but less than or equal to ten points, such as the average turnaround time for six laboratory tests, then an X & R chart should be used. If the data point is made up of 11 or more points, such as the average turnaround time for 20 randomly selected laboratory samples per day, then an X & S chart is the correct choice.
While all three chart formats have relevance in healthcare provider settings, XmR charts are becoming the preferred format owing to their ability to allow for risk adjustment and control for volume, which are important attributes in markets that value outcomes as a measure of reimbursement rather than process. Outcome measures typically include a focus on complications, readmission, length of stay and mortality and require that the full patient experience from admission to discharge is studied to identify how changes can impact multiple outcomes. Centers for Medicare & Medicaid Services’ main measures, which are used by both commercial and government payers, have traditionally been process oriented.
The ability to apply severity adjustments and small volume controls using XmR charts gives providers the flexibility needed to adapt when operating in dynamic environments such as healthcare. By taking the next step of using control charts to measure and then evaluate why process variation occurs, organizations can work towards addressing root causes, particularly those that affect cost and outcomes.
Getting Started: Assessing Opportunities To Reduce Clinical Variation
With high-stakes goals on the line, such as reducing costs per discharge and readmission rates higher than benchmarks and identified peer groups, hospitals must choose carefully when committing organizational resources towards improvement opportunities. While financial or quality reporting or even gut instincts may point to obvious candidates, a clinical variation assessment should be conducted before a formalized approach to care variation, with work plans and timelines, is launched.
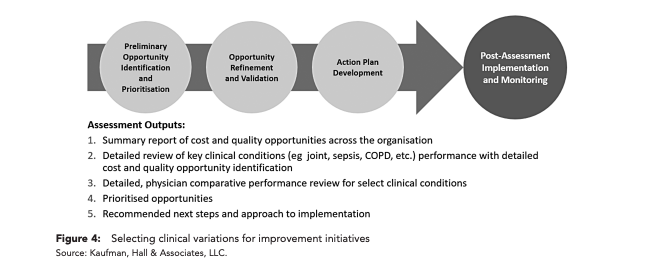
As shown in Figure 4, the assessment should include identification and prioritization of preliminary opportunities across the organization, and then detailed evaluation of important quality opportunities as indicated by measures such as risk-adjusted mortality rates, complications and preventable readmissions. A review of comparative physician performance must also be conducted, particularly among physicians who see similar patients but are exhibiting significant differences in length of stay, resource use and cost per case.
A more refined prioritization activity is next and should include considerations such as strategic rationale, political obstacles that must be addressed, physician engagement, potential to measure a successful outcome and the opportunity for significant performance improvement. These steps should lead to a prioritized set of opportunities and associated details that can serve as the foundation for the hands-on work at the program or service level.
Creating A Bottom-Up Approach To Unwarranted Clinical Variation Using Control Charts
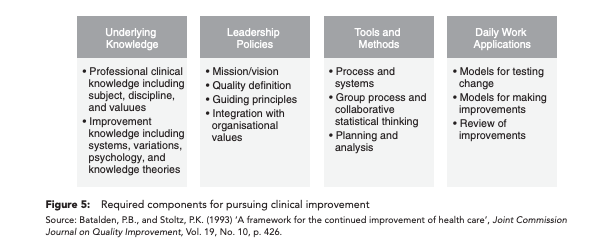
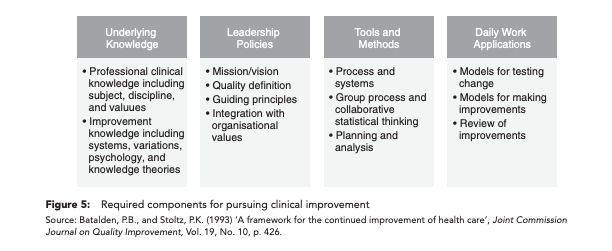
Once an opportunity for improvement has been agreed upon, addressing unwarranted clinical variation at a program or service level is best conducted as a bottom-up approach, starting at the patient encounter level. An underlying framework to guide efforts should be in place, with components, as shown in Figure 5, that include underlying knowledge, leadership policies, tools and methods, and daily work applications. This framework ensures that teams working on improvement initiatives are starting with a common background and understanding of the process and its goals.
Once the framework has been established, improvement teams should develop a simple, but specific, aim statement that summarises the magnitude of change a team hopes to achieve over a defined timeline. Strong aim statements keep teams focused and motivated to reach a goal, with a clear understanding of how success will be measured.
Before creating the aim statement, teams should be able to answer these questions:
- Where are the greatest financial and quality opportunities?
- What goals are the team trying to achieve?
- What benefits does the team expect to achieve?
- What methods will be used? Are there data or experiences to support the use of those methods?
- Where will the change occur, and when will it start and stop?
- How will the team measure and track financial benefit and improved patient outcomes?
- Are there boundaries of the processes?
Example aim statements are presented in Figure 6.
Following the development of the aim statement, use of control charts is the next task. The control limits on control charts are used to assess the stability of the process and identify outlier performance. Once a process is within the control limits and the data are clustering to the mean, improvement teams conduct rapid cycle tests of change. By conducting several small, rapid cycles of change on a clinically homogeneous set of patients — meaning similar diagnoses, planned procedures and anticipated outcomes — the goal is to evaluate the change and associated results and then revise and adapt as needed. The inclusion of evidence-based guidelines and comparisons among entities, indicators and practitioners instills competitive and accountable performance with these activities.
For example, if the reduction of Caesarean section rates is the overarching goal, teams will start by looking at what happens from admission to discharge for that patient population. What practices/protocols are used, which physician standardized order sets are utilized and at what rate, and what high-level opportunities can be identified and measured? Interventions are then overlaid at different points in time from admission to discharge. The objective is to implement the cumulative effect of interventions resulting in improvements that are quantified in measurable results. Physicians are an integral part of this process, as well as the interdisciplinary team members who treat the patient.
As the changes occur in the rapid cycle testing, ongoing monitoring is conducted as new data is collected and plotted. To assess the impact of a process change, the control limits and the center line should remain the same while new data points are plotted and the presence of special cause variation is evaluated, meaning that the new process is significantly different from the old process. Once enough data points from the new process are gathered, a new control chart may result from a shift in mean, with new control limits and a center line recalculated using new process data points.
For clinical outcome measures within homogeneous patient cohorts, risk adjustment is helpful to account for different patient characteristics. Factors such as gender, age, comorbidities and other issues may affect the probability of occurrence of a particular outcome and must be accounted for and monitored.
Avoiding Common Control Chart Mistakes
When using control charts in a healthcare environment, organizations must be alert to issues that impact the quality of the improvement process and progress towards aim statement goals.
Selecting control limits of less than or greater than 3 sigma.
When control limits of less than 3 sigma are selected, teams could incorrectly conclude that special cause tampering has occurred. When control limits of greater than 3 sigma are selected, teams could incorrectly determine that a stable process is occurring, which could lead to under-controlling of the process. Use of 3 sigma control limits will provide more accurate indicators of whether a process is stable or whether special process variation has occurred.
Reacting to a common cause variation as if it were special.
Not every type of variation needs to be acted upon. Common cause variations, meaning those that inherently exist in a process, do not need to be addressed. Introducing a change to a process to try to address common cause variation results in wasted resources and disappointing results.
Reacting to special cause variation as if it were common.
Similarly, special cause variations, whether they signal improvement or deterioration of the process, may be incorrectly classified as common cause variations, and thus may not be documented appropriately.
Setting overly ambitious goals with high levels of complexity.
Initiatives that require large numbers of staff across multiple campuses and units to engage and commit to the process should be re-scoped to smaller, more manageable efforts that can gain traction and momentum before rollout on a larger scale to high-acuity and/or high-census units.
Undervaluing the importance of engagement and communication.
Building and maintaining an organization-wide commitment and a philosophy towards clinical improvement is a substantial undertaking that requires commitment to long-term communication strategies. Overlooking the importance of regular and impactful communication can significantly slow down efforts and engender resistance to change.
For organizations that are committed to keeping average cost per discharge below benchmarks and readmission rates better than those of peer groups, and are pursuing this as a component of a well-structured quality improvement and cost transformation program, identifying and addressing unwarranted clinical variation at the program and service level needs to be a top organizational priority. By using control charts to study variation among care practices and practitioners, opportunities can be identified for improving patient safety and quality while ensuring that valuable contracts and financial incentives are retained because costs have been managed and patient outcomes improved. And when these opportunities to reduce unwarranted clinical variation are grounded in accurate and timely clinical data, data-driven decision making occurs that will be trusted by front-line clinicians charged with ensuring that improvements are implemented and additional enhancements are studied.
You also might be interested in...

Axiom Clinical Analytics
