As hospitals and health systems continue the journey toward normalcy in the wake of the COVID-19 crisis — while navigating emerging challenges, such as the Delta variant — there are many signs of recovery, as well as some ongoing struggles.
To better understand this progression, Syntellis analyzed data from more than 135,000 physicians and 1,000 hospitals in June 2021. Our analysis led to several key findings:
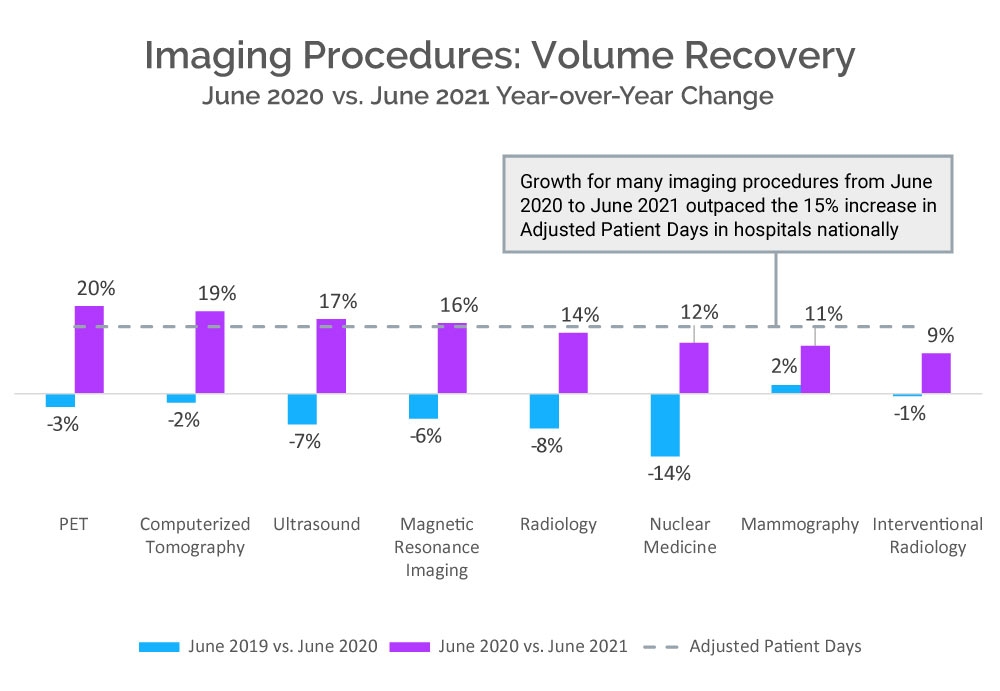
- Imaging services saw a robust increase in procedures compared to 2020, outpacing national hospital averages
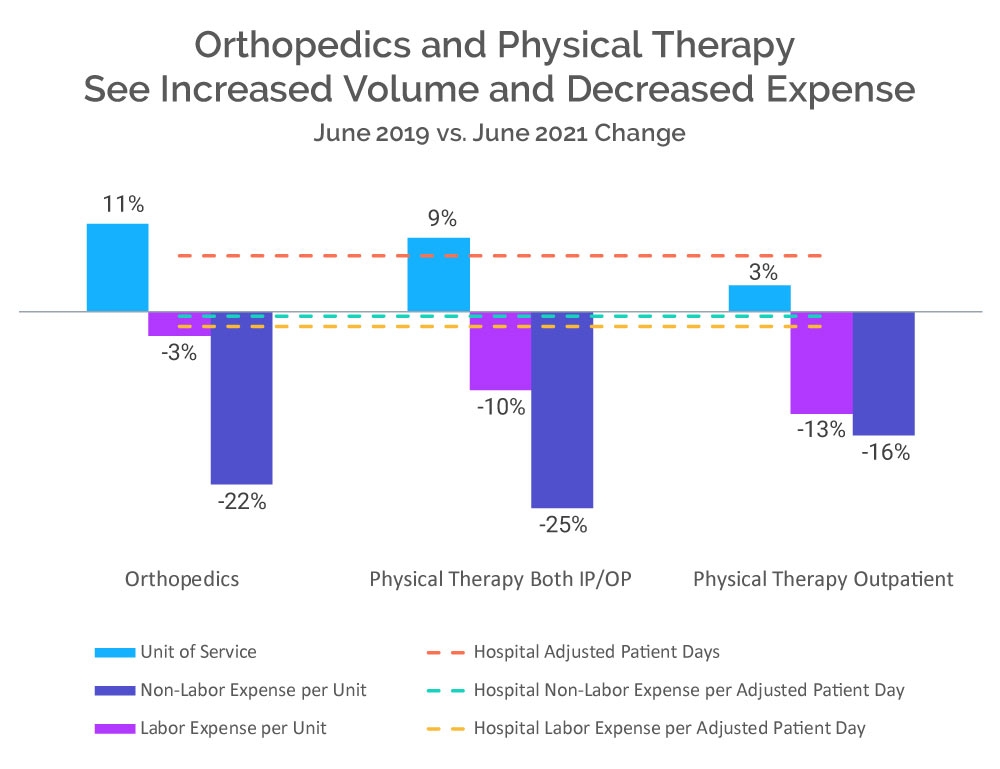
- Orthopedics and inpatient and outpatient physical therapy have experienced strong recovery in terms of patient volumes and expenses
- Pediatric and mother/baby nursing services continue to see slow recovery compared to other nursing departments, a continuation of the trend revealed in data comparing May 2019 to May 2021
Imaging Procedure Recovery Outpacing National Hospital Average
In June 2021, imaging services saw a robust increase in procedures compared to the year prior. PET, CT, ultrasound, and MRI imaging services all outpaced the 15.3% increase in total hospital activity nationwide as measured in adjusted patient days. Radiology fell just under the nationwide average, with a 13.9% increase compared to June 2020.
Mammography was the only imaging department that did not see a decrease in imaging procedure volume in June 2020 versus June 2019 and then continued to grow 10.9% in June 2021 compared to the year prior. In addition, gross revenue per procedure increased 6.7% in mammography departments.
Strong Signs of Recovery in Orthopedics and Physical Therapy
Both orthopedics and physical therapy saw an increase in patient visits in June 2021 compared to June 2019, with an 11.3% increase in orthopedics and a 9.5% increase in inpatient and outpatient physical therapy — outpacing the hospital national average of 7.2%, measured in adjusted patient days.
Orthopedics and physical therapy also saw large decreases in labor expense and non-labor expense per unit than the hospital national average in June 2021 compared to June 2019. Specifically, hospital non-labor expense per adjusted patient day declined just –1.0% from June 2019 to June 2021, while orthopedics and physical therapy (both inpatient and outpatient) non-labor expense per unit declined -22.1% to -25.1%, respectively. Similarly, hospital labor expense per adjusted patient day fell just -2.0%, while orthopedics and physical therapy (inpatient and outpatient) were down -3.1% and -10.0%, respectively, from June 2019.
Delayed Recovery in Pediatric and Mother/Baby Nursing Services Slowly Improves
As we reported earlier this month, in May 2021, pediatric, mother, and newborn nursing departments had the largest deficit in volume compared to May 2019. While patient days in many nursing departments increased in June 2021, pediatric, mother, and newborn nursing departments still accounted for four of the six lowest patient volumes.
However, select pediatric and mother/baby nursing services have seen positive patient growth. Some emergency care units saw more patient days in June 2021 than June 2019, including neonatal ICUs and pediatric ICUs with a 7.7% and 3.9% increase, respectively. The only non-emergency nursing service to see positive growth was labor/delivery/postpartum, at 1.9%.
To continue on the path toward financial strength, health systems must look for ways to maintain positive momentum while addressing departments and services that have been slow to recover. Where there are areas for improvement, hospitals and health systems can use this data to make informed planning decisions to achieve financial recovery and long-term success.
Source: Syntellis’ Axiom™ Comparative Analytics, which offers access to real-time data drawn from more than 1,000 hospitals, and 135,000+ physicians from over 10,000 practices and 139 specialty categories. Powered by Syntellis IQ, Comparative Analytics also provides the data and comparisons specific to a single organization for visibility into how their market is evolving.
Your peers also read:

6 Benchmarking and Comparative Analytics Best Practices

Market Analysis and Monthly Hospital & Physician KPIs: October 2023
