Financial institutions today have access to more data and analytics than ever before. The challenge, however, is understanding how to effectively use and interpret that data and distribute the resulting insights across the organization.
To optimize your reporting and data, you must evaluate every step of the process, from setting up data inputs to choosing how to present the data. These five strategies can set your institution up for success.
#1 — Get the Right Data into Your System at the Right Time
To set up your data imports most efficiently for general ledger, loans, deposits, and investments, you must keep the following in mind:
- Frequency: How often should you refresh data to inform reporting? Many financial institutions prefer to refresh data daily. However, not all data is optimally structured for a daily refresh; some is only prepared and made available weekly or monthly. Ultimately, you must understand your reporting systems and data storage structure so that you can determine the ideal data refresh frequency for your institution.
- Sourcing: Data should be sourced by those in your organization who understand the source system. Someone familiar with your core system, for instance, will know the difference between a loan origination date, renewal date, and rate reset date — so they can more efficiently find the necessary information. Those who source the data must also understand how individuals throughout the organization will use the data so that they can provide it in an appropriate and valuable format.
- Processing: Data file creation should be an automated process that requires no manual intervention. The resulting data file should need no formatting, modification, or content removal. You should store two copies of each automated file — one to overwrite the existing file where your software can find it and import it, and one in a separate location with a dated naming convention — in the unlikely event of system corruption.
#2 — Establish Data Hygiene Processes to Ensure Accurate Information
To create accurate reports, the data itself must be accurate. If the numbers in report A don’t match the numbers in report B, both reports lose credibility — and you must spend valuable time tracing back the data assumptions, filters, and sources.
To ensure accuracy, all reports should pull data from a single source — one with reliable validation processes. Keeping your data clean and accurate also requires setting up rules and processes and following them every time. In general, your process should follow these steps:
- Create data imports as discussed in the section above
- Establish dimensions (e.g., chart of accounts, organizational hierarchy, product and officer codes, and customer identification fields) that define how you will use the data
- Configure standard validation reports to verify data integrity (e.g., compare instrument data to general ledger account balances)
- Schedule jobs to automate sequential data processing and report creation and distribution — all without oversight
- Perform quality assurance at initial system set up and at regular intervals
#3 — Give the Right People Access to the Right Information
If your finance or accounting team is the primary user of your system, they are best equipped to provide others with the proper permissions and access to it. IT has a role to play in the overall system security, of course, but it is generally most efficient to put your finance team in charge of the security profiles.
When providing permissions, it’s important to give users access to data that is appropriate for them to see to produce accurate reports, perhaps focusing attention through guided, permissions-based workflows. Consider, for example, a budget report that details salaries and benefits for management consumption. If you calculate and store projections for each employee, that data should only be accessible by a few users. In fact, in some institutions, only HR can access this data. Instead, to ensure that the report is accessible and successfully displays the correct data, source this data from the general ledger budget table, which stores aggregated employee projections for reporting.
#4 — Automate the Reporting Process
Most steps of the reporting process can — and should — be automated:
- Gather inputs: While the source system may occasionally fail to generate a data file, this should be the exception; in most cases, gathering data inputs should not require regular manual intervention.
- Validate data: Your database should have checks built into it for key validation points and be able to notify you if any of these checkpoints fail.
- Schedule report creation and distribution: Once you test and reconcile a report and identify the audience, you should be able to schedule report creation and distribution. For example, you can automate daily reports to run every morning after the database updates overnight.
At this point, your company leadership can put the reports to use, from generating board report speaking points to analyzing trends to inform future business plans and decisions. Automation provides efficiencies that lead to a faster, smoother planning process.
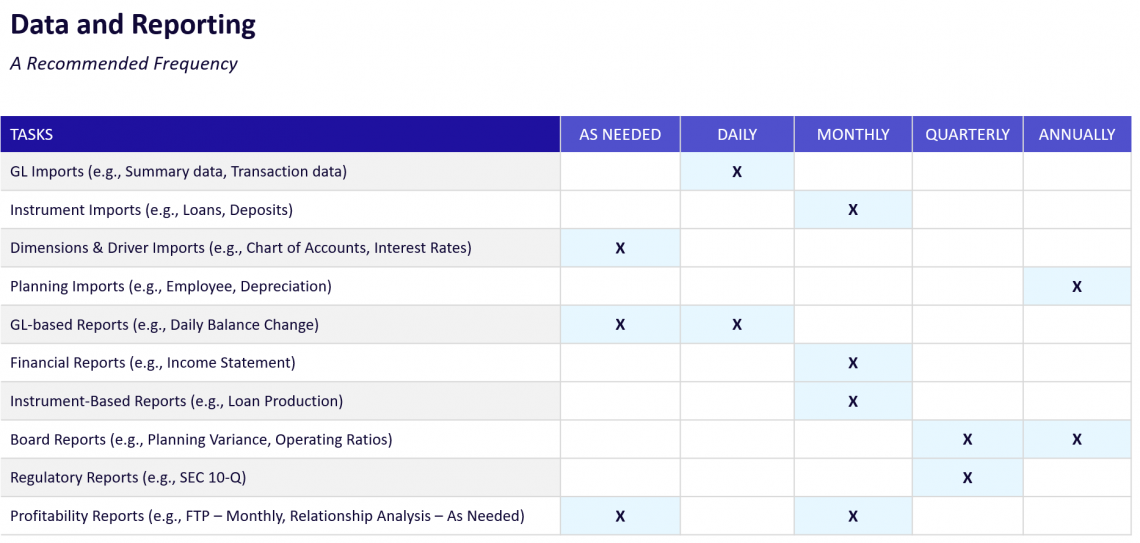
You may choose to import data and run reports on a daily, monthly, quarterly, yearly, or as-needed basis. For example, institutions typically require general ledger imports and reports on a more frequent basis (i.e., daily), while generating planning imports annually and board reports quarterly. We recommend the frequency displayed in the chart below.
#5 — Follow Reporting Best Practices
When determining what reports to create and how to use them, keep these best practices in mind:
- Instead of creating reports based on a calendar year (January through December), use a rolling 12-month trend. This supports ongoing analysis as well as budget comparison review and forecast preparedness.
- Monitor metrics using ratios. A well-formatted ratios report won’t just show you the variance from the prior month, it will also display the contributing figures (the numerator and denominator), which can help you pinpoint the source of a material ratio change.
- Compare current variance to budget or forecast. Reviewing month-to-date and year-to date-figures can help determine if a positive or negative delta is a one-time occurrence or a trend that requires review.
- Use dashboards instead of static reports. An interactive dashboard allows users to filter information and drill down into data based on what they need to know — allowing them to quickly find the exact information they need without having to sort through extraneous and irrelevant data.
- Rely on data to monitor your institution’s relationships, so you can quickly and impartially determine top- and bottom-contributing customers.
Running a successful financial organization requires accurate data, insightful analytics, and the ability to share that information across the institution. The Axiom™ Reporting and Analytics Platform simplifies this process, enabling fast and accurate analysis, robust data visualizations, tailored reports, and automated distribution. To learn more about Axiom’s comprehensive reporting capabilities, download our e-book, Axiom Standard Reports and Dashboards.
Learn more about optimizing your financial reporting:

Axiom Reporting and Analytics: Financial Institutions Solution Brief


