Following record revenue and volume losses at the beginning of the COVID-19 pandemic, hospital patient volumes and revenues remain lower than in 2019 but have improved in recent months. Unfortunately, incremental month-over-month margin increases did not continue in August, when revenues declined across the board and per-patient expenses again increased.
We’ll continue monitoring data and share what we learn. Here are the August 2020 financial key performance indicators (KPIs) for hospitals and health systems:
#1 — CARES funding reduces but does not eliminate revenue gaps
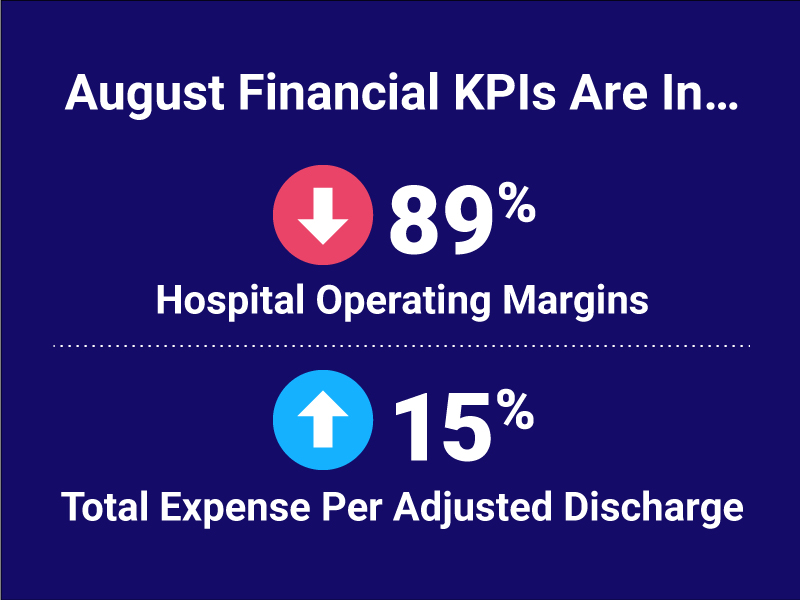
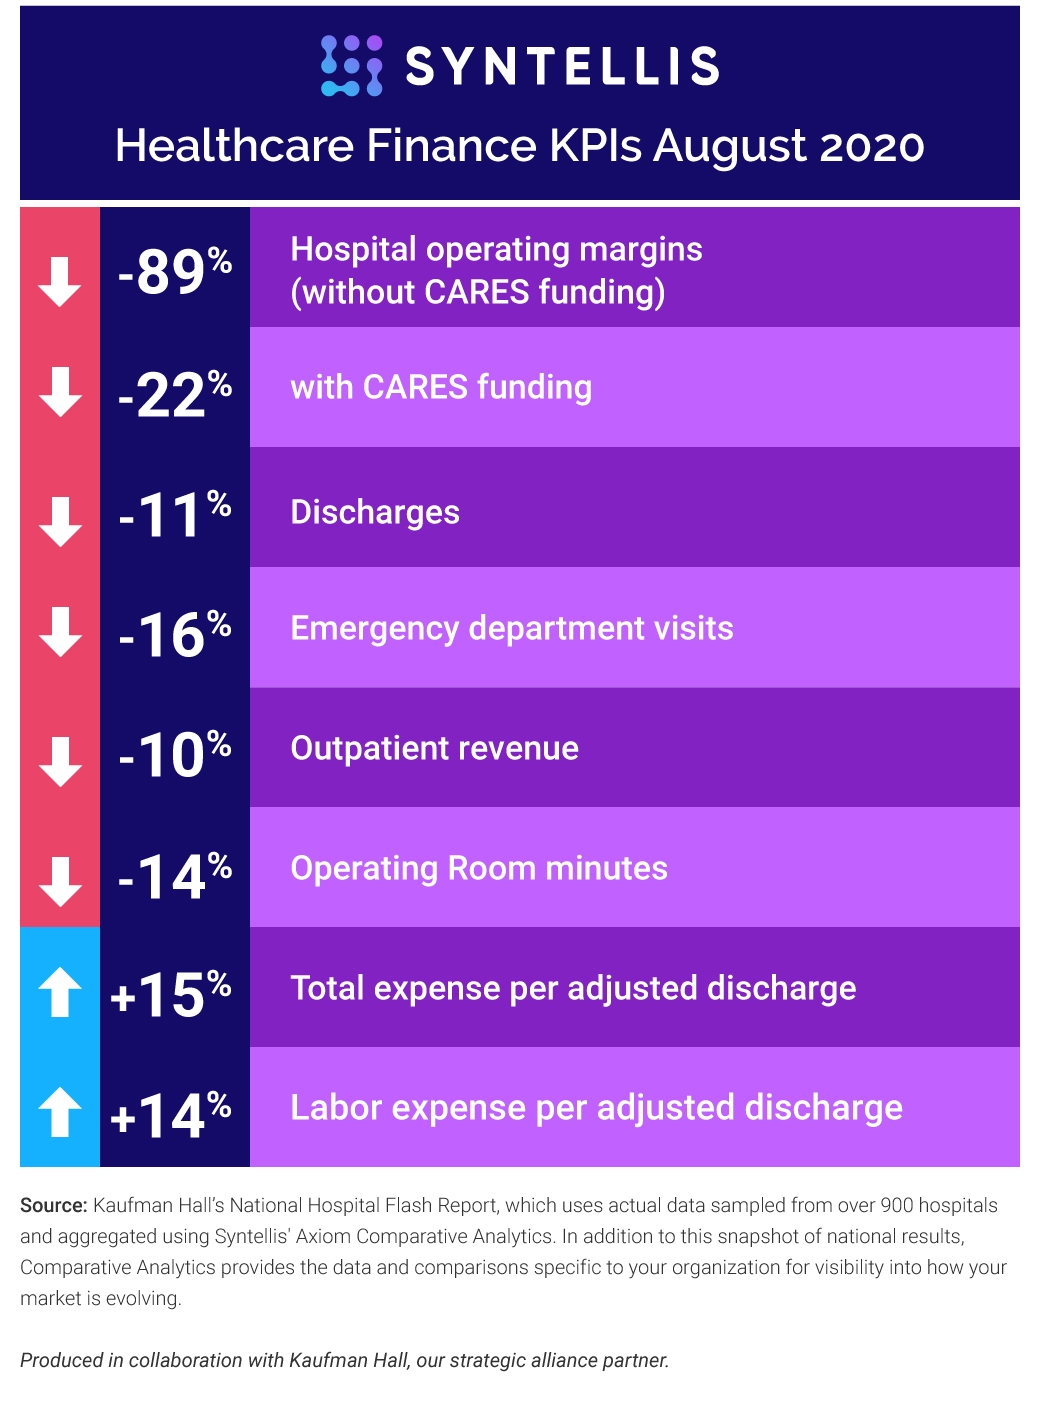
Operating Margin is down 89% year-to-date without CARES funding and 22% year-to-date with the funding.
#2 — Patient volumes fell again
Discharges are down 11% compared to January-August 2019, and dropped 2% month-over-month.
#3 — Emergency department volumes remain especially low
ED visits declined 16% year-to-date compared to the same period in 2019, and dropped 2% month-over-month.
#4 — Operating room minutes decreased
Operating Room minutes are down 14% year-to-date and fell 6% year-over-year and month-over-month.
#5 — Fewer outpatient visits have contributed to revenue declines
Outpatient Revenue was down 10% compared to January-August 2019.
Monthly Spotlight: Expenses
In all categories, expenses continue to rise. Total Expense per Adjusted Discharge jumped 15% year-over-year, 3% month-over-month. Labor Expense per Adjusted Discharge increased 14% compared to August 2019 and 4% compared to July 2020. Non-Labor Expense per Adjusted Discharge is up 15% from January-August 2019. Supply Expense per Adjusted Discharge is up 11%; Drug Expense per Adjusted Discharge is up 16%; and Purchased Service Expense per Adjusted Discharge is up 19% year-to-date.
Turning Data Into Action
With no end to the pandemic in sight and expenses continuing to climb, the imperative for hospitals to manage and reduce costs has never been greater. Unfortunately, fewer than half of healthcare finance professionals have reliable, trusted costing data to guide cost reduction initiatives.1
Now is the time to resolve this challenge by rethinking cost accounting tools and processes to ensure data accuracy and accessibility. Necessary features needed today include the ability to create or update revenue offsets for COVID-related revenue (e.g., CARES Act payments) to reflect the net financial impact in service line reporting and analytics. Learn more about modern cost accounting solutions.
Source: Kaufman Hall’s National Hospital Flash Report, which uses actual data sampled from over 900 hospitals and aggregated using Syntellis' Axiom™ Comparative Analytics. In addition to this snapshot of national results, Comparative Analytics provides the data and comparisons specific to your organization for visibility into how your market is evolving.
1 Randa, K., Robinson, L., Gundling, R., Mulvany, C., The State of Healthcare Performance Improvement: Strategy, Technology, and Tactics in 2019. Kaufman Hall, 2019.


