Though we’ve made great strides in combatting the pandemic over the past year and vaccine efforts offer hope that things may return to “normal” in the not-too-distant future, physician practices continue to feel the effects of COVID-19. Data from more than 125,000 physicians show that practices nationwide continue to face significant financial pressures caused by the pandemic.
Here are the top five financial and operational KPIs from the quarter ending in February 2021 (December 2020-February 2021) for physician practices across the U.S.:
#1 — Volume, productivity remain below pre-pandemic levels
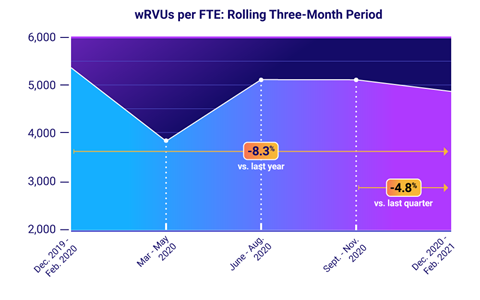
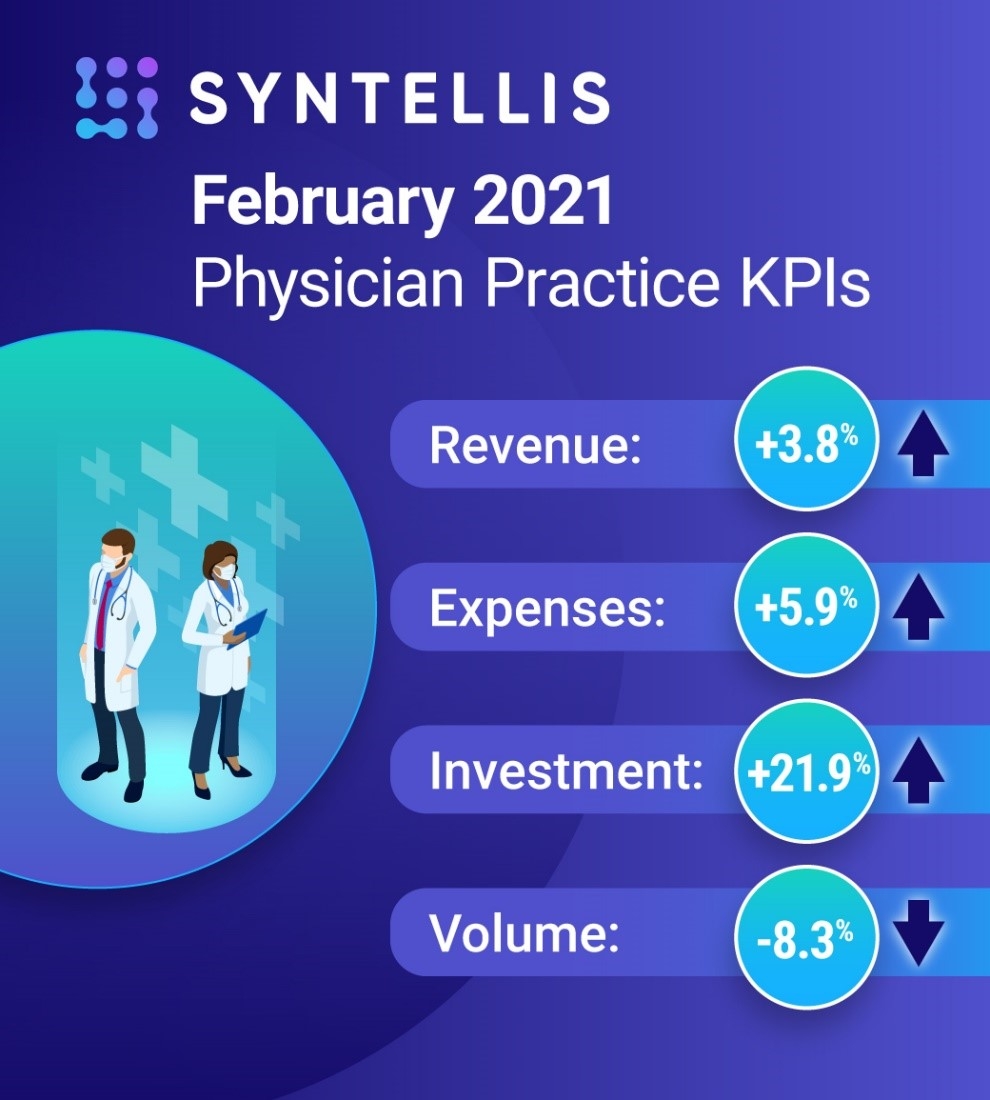
In February 2021, Physician wRVUs per FTE were 8.3% below the same three-month*, pre-pandemic period last year. Compared to the November 2020 quarter, Physician wRVUs per FTE fell 4.8%, indicating a slow start to the year.
#2 — Revenue continues to show signs of improvement
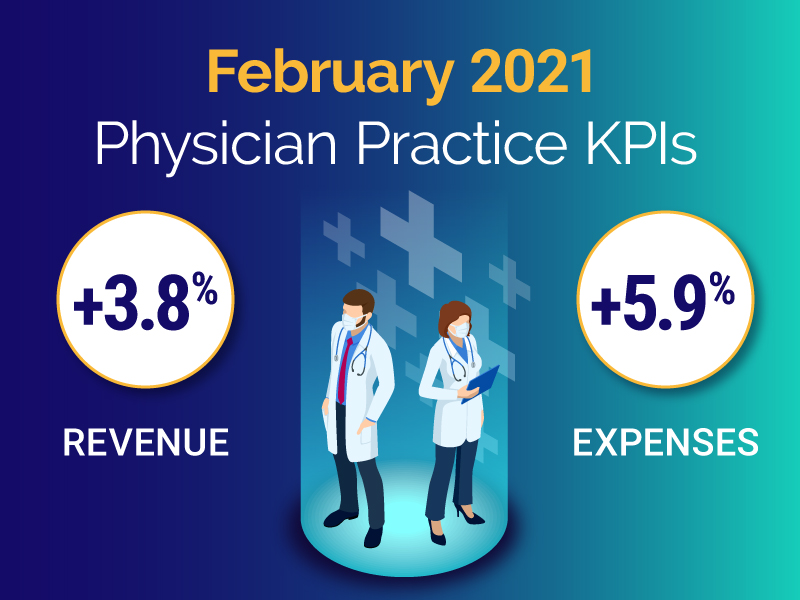
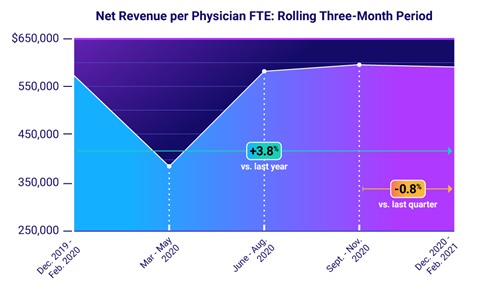
Net Revenue per FTE increased 3.8% compared to the February 2020 quarter, but took a slight hit — 0.8% decrease — compared to the November 2020 quarter. Net Revenue per Physician wRVU increased 16.8% since the same three-month period last year and 10.3% in February 2021 compared to November 2020.
#3 — Expenses reach 12-month peak
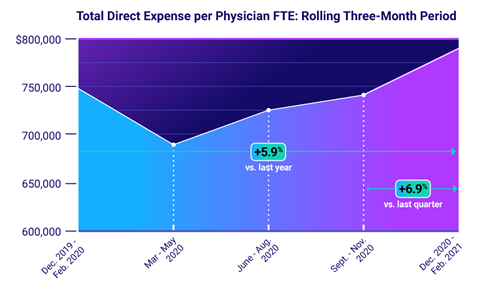
Expenses hit a peak average of $790,520 per Physician in the February 2021 quarter. Total Direct Expense per Physician FTE was 5.9% higher than the February 2020 quarter and increased 6.9% compared to the November 2020 quarter.
#4 — Additional investment needed to offset lost revenue and climbing expenses
Investment per Physician FTE increased 21.9% in February 2021 compared to the same quarter last year and 22.7% compared to November 2020, primarily driven by rising expenses. Health systems invested an average of $230,209 per physician in the February 2021 quarter.
#5 — Support staff levels fall
In February 2021, Support Staff FTEs per wRVUs fell 2.5% compared to the February 2020 quarter. A sharp drop of 20.9% compared to the May 2020 quarter indicates that this may be due to practices adopting new, smoother operational and administrative processes to address changing requirements for care delivery.
Spotlight on Primary Care
Despite an effective vaccine rollout in the first few months of 2021, physician practices are slow to recover financially. Primary Care, specifically, is experiencing difficulty in returning to pre-pandemic levels. To keep these practices afloat, health systems are increasing investments in Primary Care more than any other specialty, when compared to the February 2020 quarter.
Here are the February 2021 KPIs for Primary Care:
- Physician wRVUs per FTE decreased 16.4% compared to the February 2020 quarter
- Total Direct Expense per FTE increased 2.7% compared to the same quarter last year
- Investment per Physician FTE rose 49.9% over February 2020 levels
- Support Staff FTEs increased 3% compared to the same three-month period last year
COVID-19 Recovery Efforts Require Robust Data
The data illustrates the continued financial impacts of the pandemic on physician practices. Moving forward, physician practices and the health systems that operate them need reliable data to track KPIs in real time and effectively guide recovery efforts.
Syntellis’ Axiom™ Comparative Analytics solution enables healthcare leaders to leverage data to monitor performance across the physician enterprise and identify opportunities for improvement to support informed decision-making.
Syntellis’ Axiom™ Comparative Analytics offers access to real-time data drawn from more than 125,000 physicians from over 10,000 practices and 139 specialty categories. Healthcare finance leaders can break out the data by individual physician, non-provider staff, job code, pay type, and account levels. The data can be customized into specific peer groups — by specialty performance, regional comparisons, urban versus rural, etc. — for unparalleled comparisons to drive operational decisions and performance improvement initiatives.
*Data is presented on a rolling 3-month basis. February 2021 refers to the December 2020-February 2021 quarter. November 2020 refers to the September-November 2020 quarter
Read more about physician KPIs:
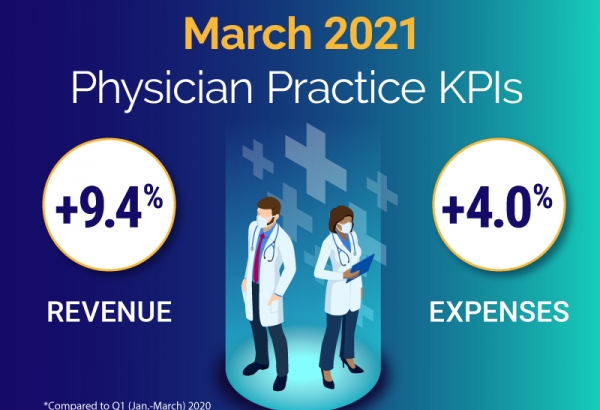
Top 5 Physician Practice Financial KPIs from March 2021

Top 5 Physician Practice Financial KPIs from 2020


