Looking back on the first six months of 2021, key performance metrics have greatly improved over 2020 metrics during the worst of the pandemic shutdowns. However, 2021 margins and volumes remain below pre-pandemic numbers from the first six months of 2019, not including CARES Act funding. Expenses rose above 2019 numbers, and revenues were higher than in the past two years.
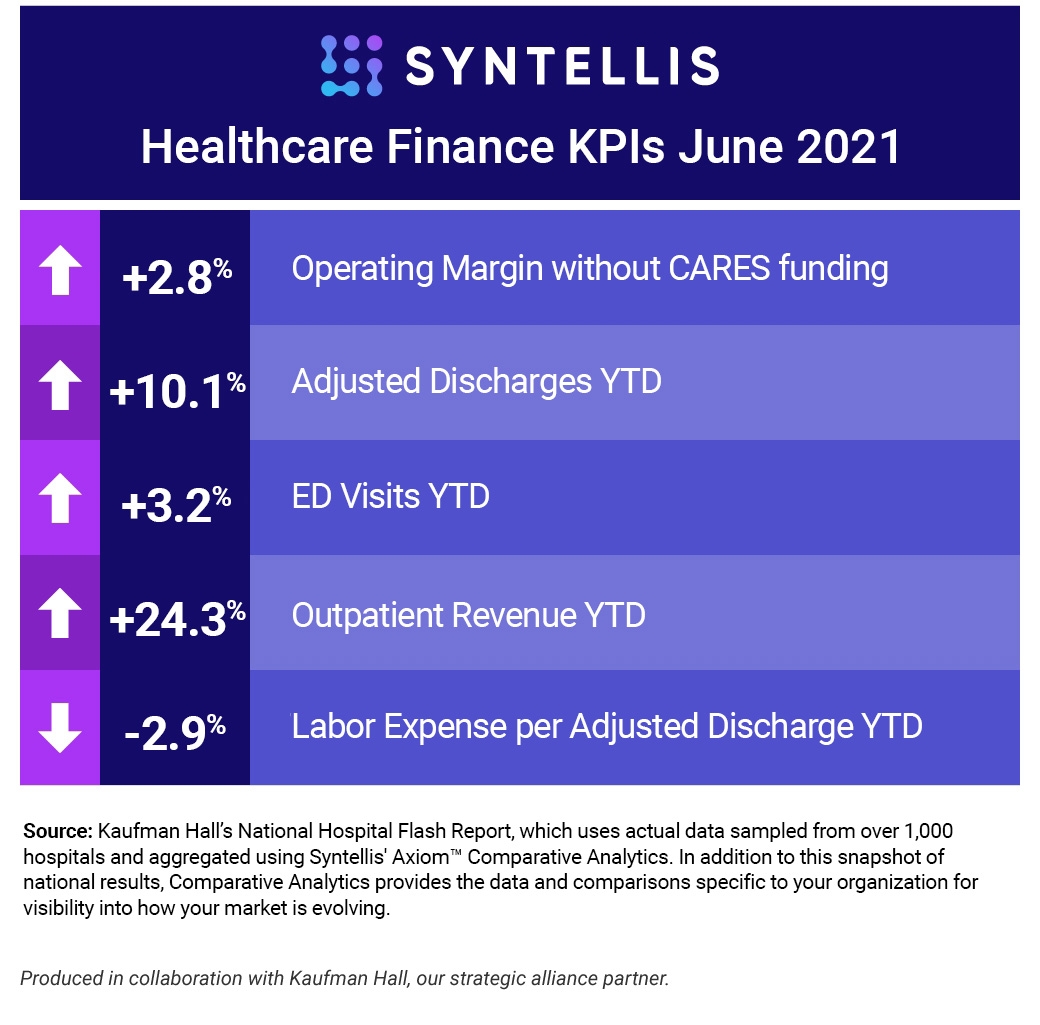
Here are the June 2021 financial KPIs for U.S. hospitals and health systems:
#1 — Operating Margins climb higher
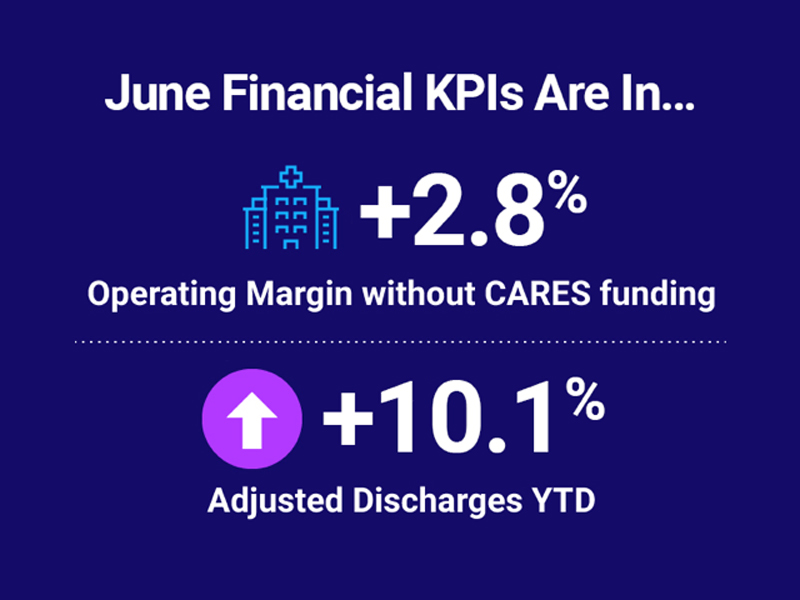
Median Operating Margin in June was 2.8% without CARES funding and 4.3% with CARES — percentages that continue to grow and reflect across-the-board increases in patient volumes.
#2 — YTD Adjusted Discharges also improving
Adjusted Discharges rose 10.1% year-to-date (YTD) compared to 2020 but fell 4.4% YTD compared to 2019.
#3 — ED Visits recovering slowly
Like many metrics this month, Emergency Department (ED) Visits rose 3.2% YTD against 2020 but were down 14.8% from 2019 levels.
#4 — Revenue trends higher
Outpatient Revenue continues to be a bright spot, rising 24.3% YTD against 2020 and 9.6% higher than YTD 2019. Inpatient Revenue grew 11.9% YTD versus 2020 and 3.3% against 2019 YTD numbers.
#5 — Labor, Non-Labor expenses mixed
Labor Expense per Adjusted Discharge fell 2.9% YTD compared to 2020 but rose 13.7% against 2019 figures. Likewise, Non-Labor Expense per Adjusted Discharge fell 2.2% YTD against 2020 but was 16.5% higher YTD than in 2019.
Monthly Spotlight: Total Expense per Adjusted Discharge
More than any metric this month, Total Expense per Adjusted Discharge shows the importance of keeping a close watch on the interplay between revenue and expenses. Total Expense per Adjusted Discharge fell 2.6% YTD compared to 2020 but rose 14.5% YTD versus 2019 numbers. Financial leaders must determine whether the poor performance against 2019 expense metrics is a blip or a new trend they must deal with.
Turning Data into Action
As the economic effects of the pandemic linger among the nation’s hospitals and health systems, Treasury Operations teams must keep a close watch on key financial resources — cash, credit, leverage, and invested assets — to ensure agility.
Syntellis’ Axiom™ Treasury Cash Management solution saves time and improves the accuracy of daily cash monitoring to optimize working capital. Accurate, timely data allows healthcare finance teams to properly size and manage cash reserves, automate payment and data infrastructure, manage commercial banking relationships, and monitor points of tension to lower costs and optimize access to capital and credit. At a time when agility is especially critical, Treasury Cash Management ensures there’s enough cash on hand at the right time to fund core business operations.
In addition to aggregating data from more than 1,000 hospitals to analyze these KPIs, Axiom™ Comparative Analytics incorporates comparison data from 135,000 physicians across 10,000+ practice departments, allowing healthcare leaders to measure performance in a variety of dimensions, including investment and net revenue per physician FTE, practice financials, specialty, and geographic region. Available data includes provider compensation and productivity by named physician and support staff analysis by named APP.
Read more about healthcare KPI data
Top 10 Financial and Operational Metric Areas for Healthcare
Top 5 Healthcare Finance KPIs: May 2021

