Executive Summary
Margin Pressures Mount for U.S. Providers
Hospitals, health systems, physician practices, and other healthcare providers nationwide faced ongoing and unsustainable margin pressures in May as inflation and widespread labor shortages continued to drive up expenses.
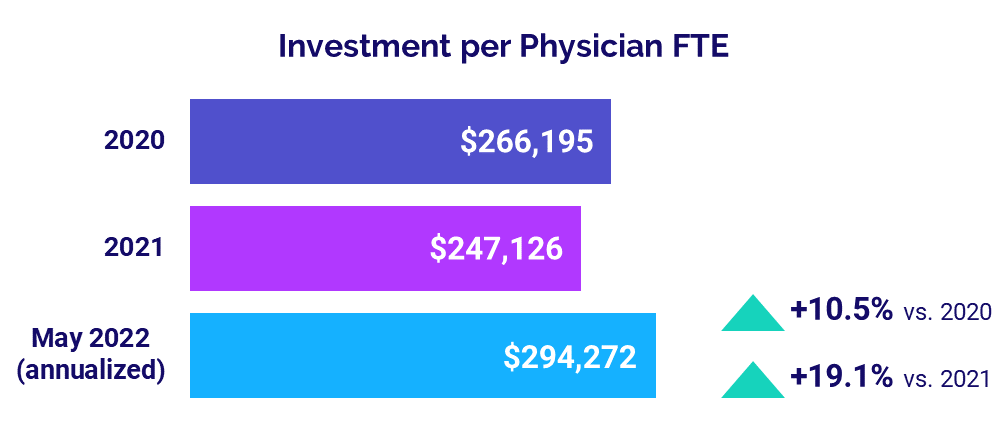
Those rising costs combined with weak volumes contributed to a fifth consecutive month of operating margin declines for U.S. hospitals and health systems in May. Higher expenses also continued to push up the level of investment needed to support physician practices, with the annualized median Investment per Physician Full-Time Equivalent (FTE) climbing to $294,272 for the month.
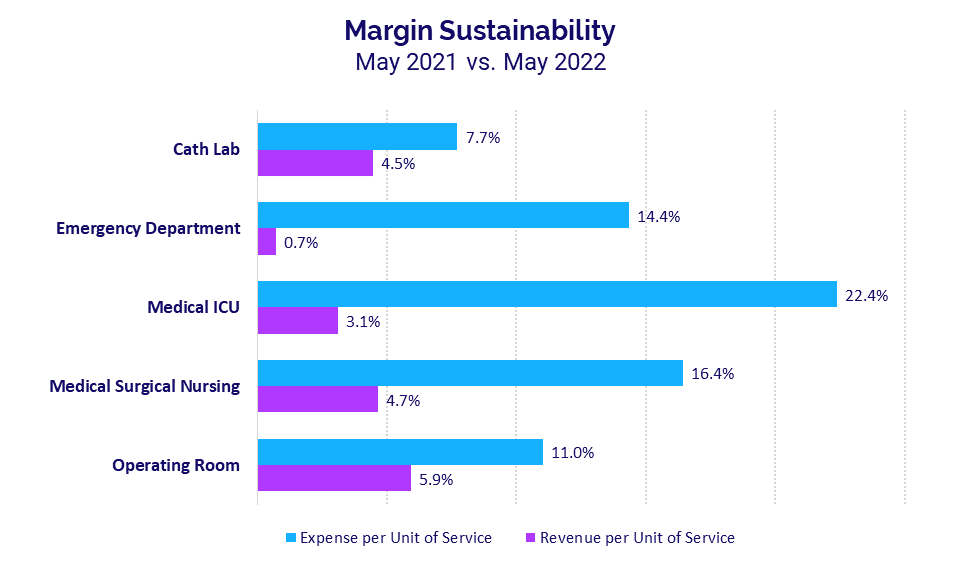
For hospitals, the relentless expense increases are far outpacing revenue growth in key departments. In Medical Intensive Care Units (ICUs), for example, Expense per Unit of Service jumped 22.4% year-over-year in May compared to a 3.1% increase in Revenue per Unit of Service over the same period.
A deeper dive showed that performance was driven largely by mounting expenses in specific areas, depending on the department. For Medical Surgical Nursing departments, labor expenses were significantly higher for low- versus high-performing departments, while medical supply expenses were primary drivers of performance for Cath Labs.
On the clinical side, hospitals nationwide saw an increase in Observation Hours over the past three years. Due to the inherent link between care quality, outcomes, and costs, this report will continue to examine these and other clinical data trends in future issues.
Key results from our latest data include:
- Per-unit Medical ICU Expense vs. Revenue gap was +19.3 percentage points
- Labor Expense for low- vs. high-performing Med. Surgical Nursing departments was +42.3%
- Observation Hours per Encounter for high performers rose +35.3% over three years
- Hospital Operating Margins decreased -43.8% year-over-year
- Median Physician Investment rose +19.1% year-over-year
Steve Wasson
EVP and GM, Data and Intelligence Solutions
Syntellis Performance Solutions
Market Analysis
Key May market analysis metrics include:
- Year-over-year change in Medical ICU Expense per Unit of Service +22.4%
- Year-over-year change in Medical ICU Revenue per Unit of Service +3.1%
- Med. Surg. Nursing Labor Expense per EPD (difference in low vs. high performers) +42.3%
- Three-year change in Observation Hours per Encounter (for high performers) +35.3%
Expense Growth Outpaces Revenues
Core hospital and health system departments continued to see expense increases far exceed revenue growth in May, reflecting the unsustainable margin performance that is plaguing organizations nationwide.
Medical ICUs had the biggest gap. Expense per Unit of Service jumped 22.4% year-over-year in May compared to a 3.1% increase in Revenue per Unit of Service over the same period. That represents a 19.3 percentage-point difference, down slightly from April’s 21.3 percentage-point difference. May was the seventh consecutive month in which Medical ICU expenses outpaced revenue growth.
Emergency Departments (EDs) had the second largest gap at 13.7 percentage points in May, with Expense per Unit of Service increasing 14.4% versus a 0.7% increase in Revenue per Unit of Service year-over-year.
Expense Strains Vary by Department
Deeper analyses of revenues versus specific expense categories across various departments confirm that labor expenses are a significant contributor to rapidly rising expenses. The analyses also reveal key differences in high- versus low-performing departments,i with expense variations driven by different factors depending on department.
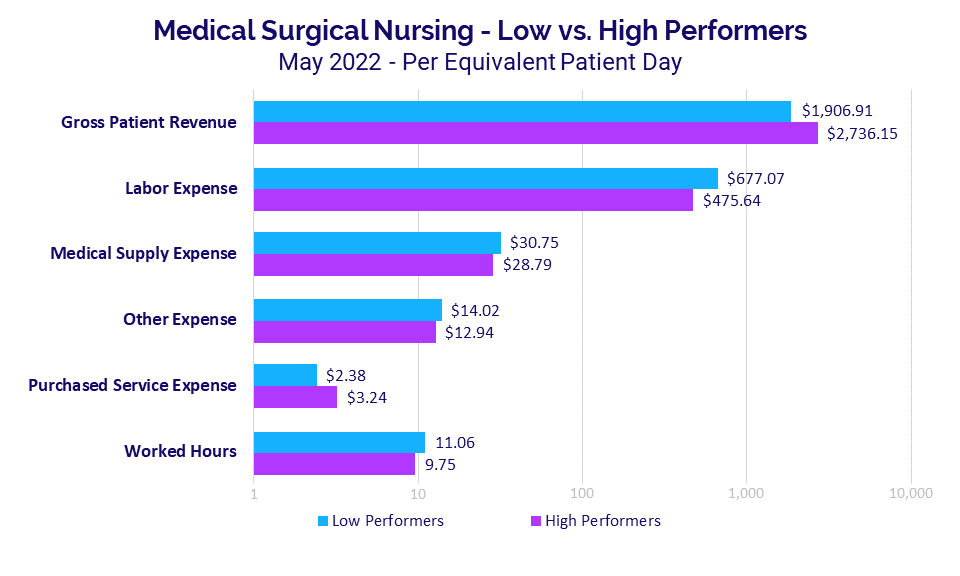
For Medical Surgical Nursing, for example, Gross Patient Revenue per Equivalent Patient Day (EPD) was 43.5% higher at $2,736.15 for high-performing departments versus $1,906.91 for low-performing departments. The inverse was true for Labor Expense per EPD, which was 42.3% higher for low-performing departments versus high-performing departments.
High-performing departments had 36.1% higher Purchased Service Expense per EPD, while Worked Hours per EPD and more costly Medical Supply Expense and Other Expense per EPD were higher for low-performing departments at 13.4%, 6.8%, and 8.3%, respectively.
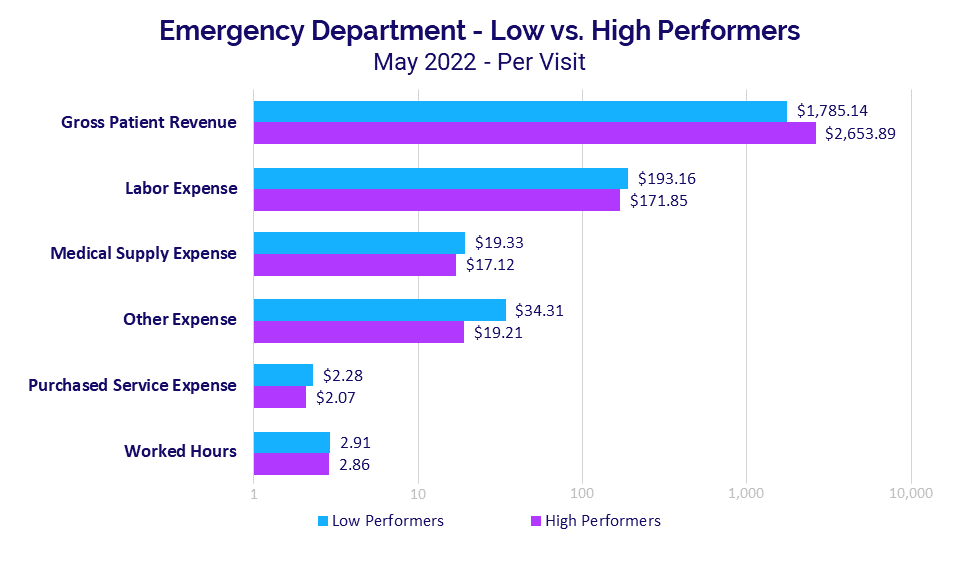
For Emergency Departments (EDs), the median Gross Patient Revenue per Visit was 48.7% higher for high performers at $2,653.89 versus $1,785.14 for low performers.
In this case, Labor Expense per Visit was 12.4% higher at $193.16 for low performers versus $171.85 for high performers. The Other Expense per Visit metric showed the biggest variation for EDs, with low performers 78.6% higher at $34.31 compared to $19.21 for high performers. The wide variation likely reflects variations in professional fees that are a part of this expense category.
ED Worked Hours per Visit were nearly the same with low performers just 1.7% higher for the metric at 2.91 versus 2.86 for high performers.
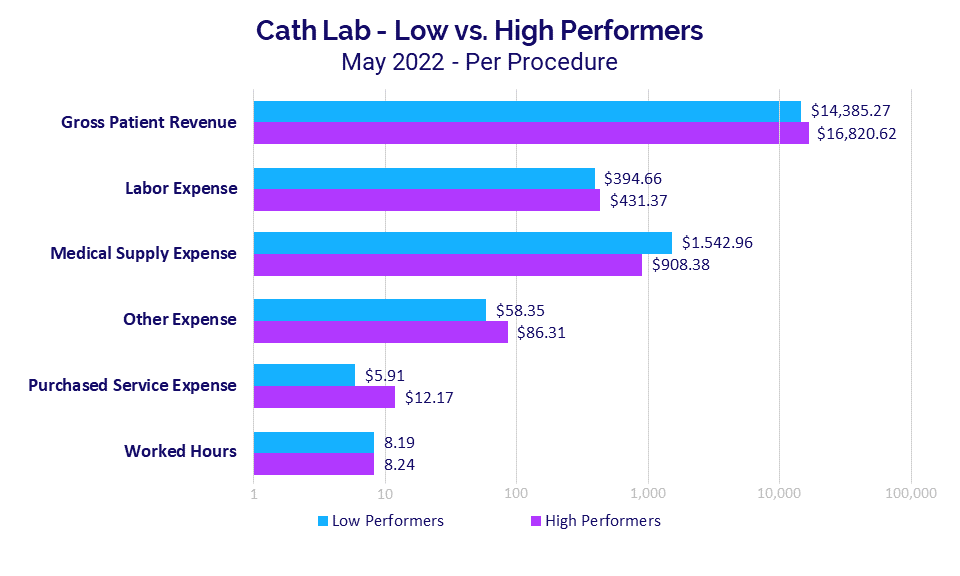
Gross Patient Revenue per Procedure for Cath Labs was 16.9% higher at $16,820.62 for high performers versus $14,385.27 for low performers. Variations in performance for these departments were driven largely by medical supplies.
Medical Supply Expense per Procedure was 69.9% higher for low performers at $1,542.96 versus $908.38 for high performers. The impact of supply expenses is further illustrated in that other expense areas actually were higher for high-performing organizations. For example, Labor Expense per Procedure and Purchased Service Expense per Procedure both were higher for high- versus low-performing Cath Labs.
Observation Hours on the Rise
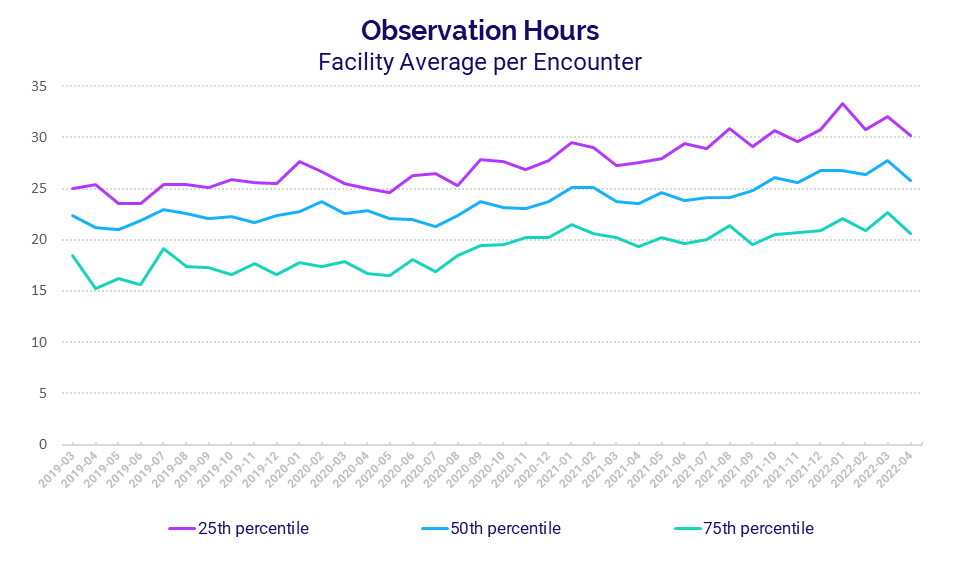
Looking at clinical data, average Observation Hours per Encounter have increased over time, despite fluctuations from month to month and significant variations between hospitals in the 25th versus 75th percentiles on this metric.
For hospitals in the 25th percentile, Observation Hours per Encounter rose 18.9% over a three-year period from 25.4 in April 2019 to 30.2 in April 2022. Over the past few years, the metric varied as much as 41.7% from a low of 23.5 in May 2019 to a high of 33.3 in January 2022.
For hospitals in the 75th percentile, Observation Hours per Encounter climbed 35.3% over the three years from its low of 15.3 in April 2019 to 20.7 in April 2022. Variation from that April 2019 low reached a peak increase at 47.7% compared to the metric’s high point of 22.6 in March 2022.
Given the inherent correlation between clinical and financial performance, Syntellis will be exploring these trends and changes in other key clinical indicators in future issues of this report.
Hospital KPIs
The top five financial KPIs for U.S. hospitals and health systems in May compared to May 2021 were:
- Operating Margin (without CARES): -43.8%
- Labor Expense per Adjusted Discharge: +14.3%
- Total Expense per Adjusted Discharge: +13%
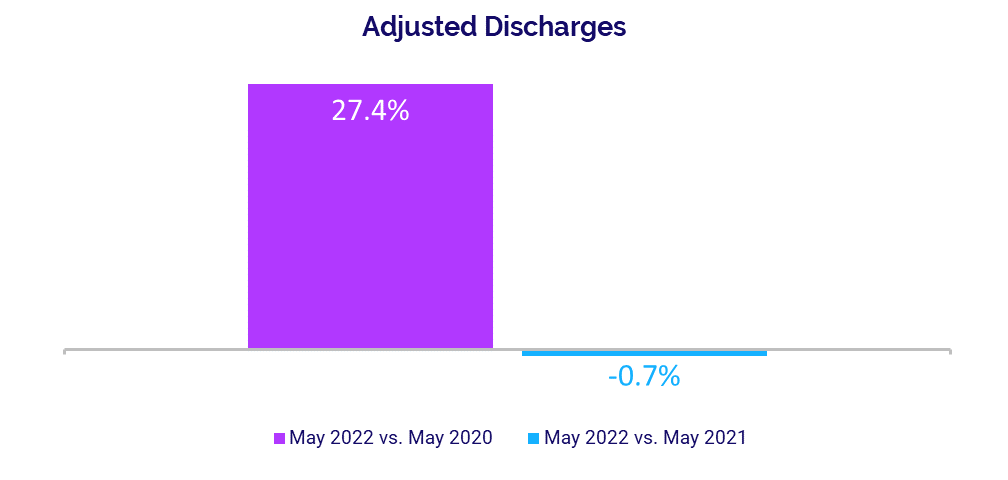
- Adjusted Discharges: -0.7%
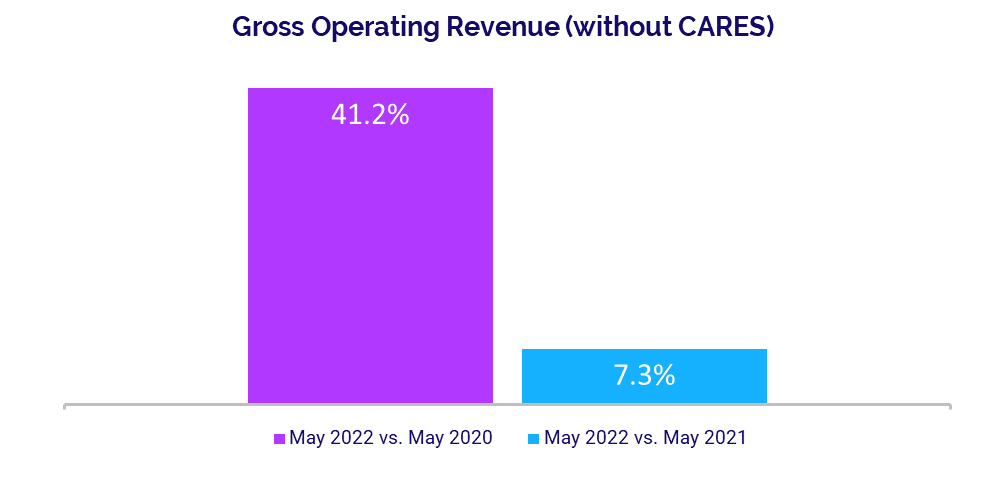
- Gross Operating Revenue: +7.3%
Operating Margins Face Sustained Pressure
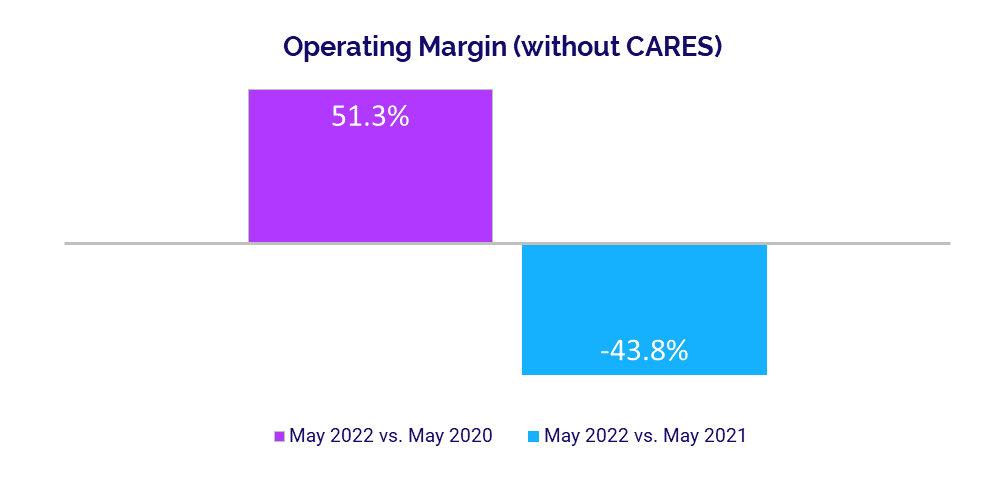
Hospital margins decreased year-over-year for a fifth consecutive month as organizations face continued pressures from rising expenses. The median change in hospital Operating Margin was down -43.8% year-over-year, not including federal Coronavirus Aid, Relief, and Economic Security (CARES) funding.ii Compared to the third month of the COVID-19 pandemic in May 2020, however, the median change in Operating Margin (less CARES) was up 51.3%.
The median change in Operating Earnings Before Interest, Taxes, Depreciation, and Amortization (EBITDA) Margin was down -38.6% year-over-year but up 34.4% versus May 2020, without CARES. Operating EBITDA Margin changes declined for hospitals across all regions, with decreases ranging from -19% for hospitals in the Great Plains to -43% for hospitals in the South.
Expense Increases Persist
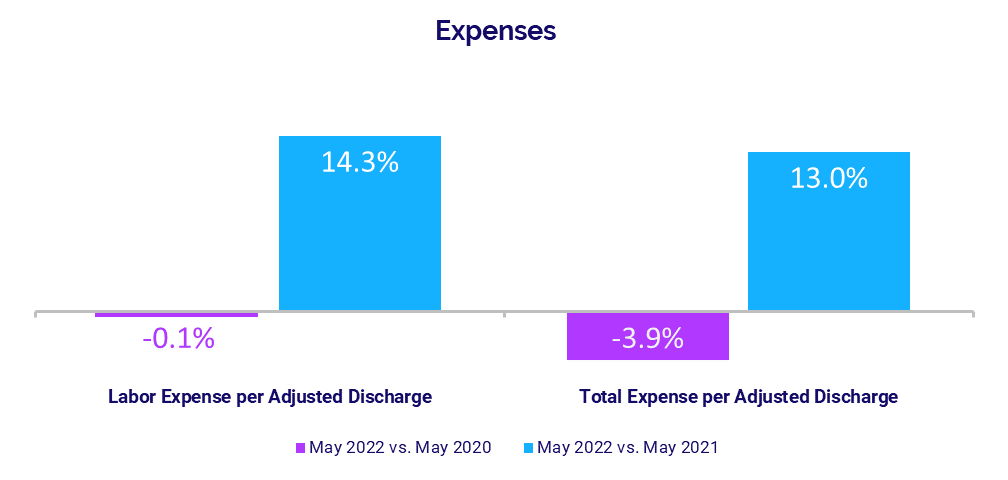
Expenses again rose year-over-year, as hospitals and health systems continue to feel the effects of inflation and nationwide labor shortages. Labor Expense per Adjusted Discharge had the biggest increase, rising 14.3% in May compared to the same month in 2021. Higher wages remained a primary driver of the increase, as evidenced by a slight decline in staffing levels with FTEs per Adjusted Occupied Bed (AOB) down -1.3% year-over-year.
Total Expense per Adjusted Discharge jumped 13% year-over-year while Non-Labor Expense per Adjusted Discharge increased 11.5%. Expenses decreased somewhat compared to the May 2020, with Total Expense per Adjusted Discharge down -3.9%, Labor Expense per Adjusted Discharge down -0.1%, and Non-Labor Expense per Adjusted Discharge down -6.5%.
Volume Performance Mixed
Hospital volumes had mixed performance in May as recovery from January’s surge in COVID-19 Omicron cases continues to stagger. Adjusted Discharges remained nearly flat, decreasing -0.7% year-over-year. Most other volume metrics showed moderate year-over-year increases: Adjusted Patient Days rose 3.7%, Average Length of Stay was up 5.7%, and Emergency Department (ED) Visits increased 3.7%. Operating Room (OR) Minutes had only a slight increase over May 2021 at 0.5%.
Volume increases were greater and more consistent compared to the third month of the pandemic, when many hospitals continued to see dramatic volume declines due to COVID-19 related shutdowns. Compared to May 2020, Adjusted Discharges rose 27.4%, Adjusted Patient Days increased 34.6%, ED Visits were up 42.6%, and OR Minutes rose 36.2%.
Revenues See Moderate Gains
Gross Operating Revenue rose 7.3% year-over-year in May, due largely to a 9.3% increase in Outpatient Revenue over the same period. Inpatient Revenue had a more moderate increase at 2.7% compared to May 2021. Increases were more significant versus two years ago, with Gross Operating Revenue up 41.2%, Outpatient Revenue up 57.9%, and Inpatient Revenue up 20.8% compared to May 2020.
Revenue performance varied for hospitals across different regions. Hospitals in the Great Plains had the biggest increases, with Net Patient Service Revenue (NPSR) per Adjusted Discharge up 28.8% year-over-year in May. Hospitals in the Midwest, Northeast/Mid-Atlantic, and West also had increases ranging from 1.2% to 8.7%, while the metric decreased -1% year-over-year for hospitals in the South.
Physician Practice KPIs
The top five physician financial and operational KPIs for May annualized versus 2021 were:
- Investment: +19.1%
- Total Direct Expense: +9.1%
- Productivity: +10.1%
- Revenue: +3.8%
- Support Staff Levels: +1.1%
Physician Investments Remain on the Rise
Investments needed to support physician practices continued to grow in May. The annualized median Investment per Physician FTE was $294,272 in May, up 19.1% compared to 2021 and 10.5% versus 2020.
The median Investment per Physician FTE rose above 2020 and 2021 levels across four of five specialties. Obstetrics and Gynecology (Ob/Gyn) again had the biggest increases, with the metric rising 42.3% versus 2021 and 25.8% compared to 2020. Primary Care was the only specialty to see a decrease, with the metric down -9.9% from 2020 but up 11.6% from 2021.
Looking at practices by region, May annualized Investment per Physician FTE increased for physicians nationwide compared to both 2020 and 2021. The West had the biggest increase from 2021 at 40.4% while the Great Plains had the biggest increase from 2020 at 24.9%.
Physician Expenses Continue to Mount
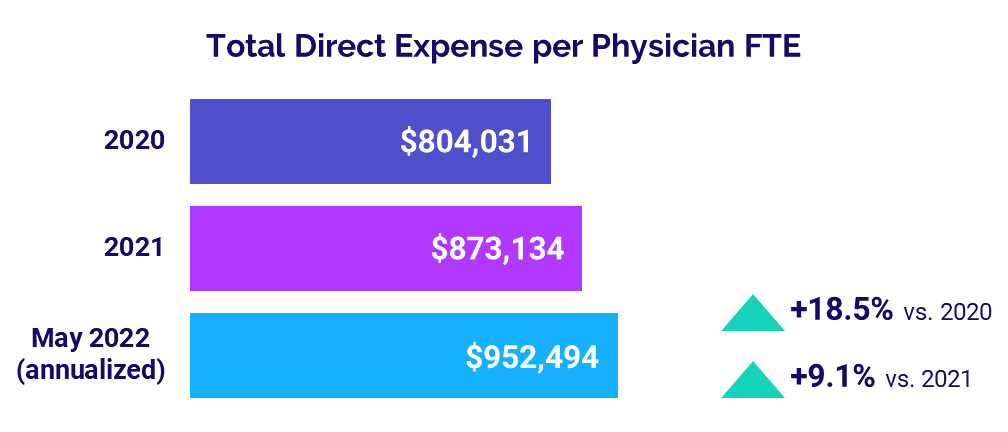
Physician practices nationwide were hit with ongoing expense increases as inflation and labor shortages persist. Annualized median Total Direct Expense per Physician FTE (including advanced practice providers) was $952,494 in May. That was up 9.1% versus $873,134 in 2021 and up 18.5% versus $804,031 in 2020.
The metric increased for practices across all specialties and all regions from 2020 to May 2022. Surgical Specialties had the biggest increases versus other specialties, with Total Direct Expense per Physician FTE rising 11.4% from 2021 and 22.1% from 2020 to $1.15 million in May 2022 (annualized). By region, the West had the biggest increases, with the metric up 14.5% from 2021 and 27.1% from 2020.
Physician Productivity Grows
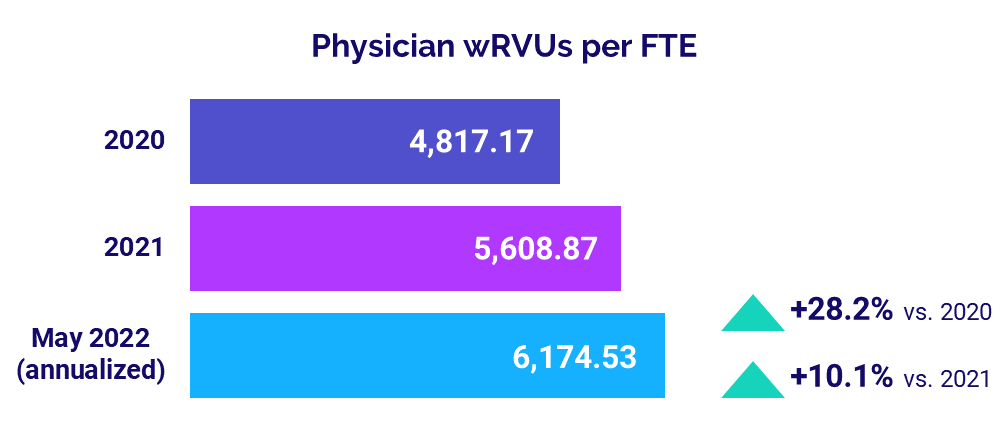
Physician productivity rose again in May as patient volumes climbed heading toward the summer months. May’s annualized median Physician work Relative Value Units (wRVUs) per FTE were 6,174.53, up 10.1% from 2021 and up 28.2% from 2020.
Physician wRVUs per FTE rose across all specialties for physician practices nationwide. Ob/Gyn had the biggest increase from 2021, with the metric up 16.1%. Primary Care had the biggest increase from 2020 at 30.2%.
Physician Revenues Increase
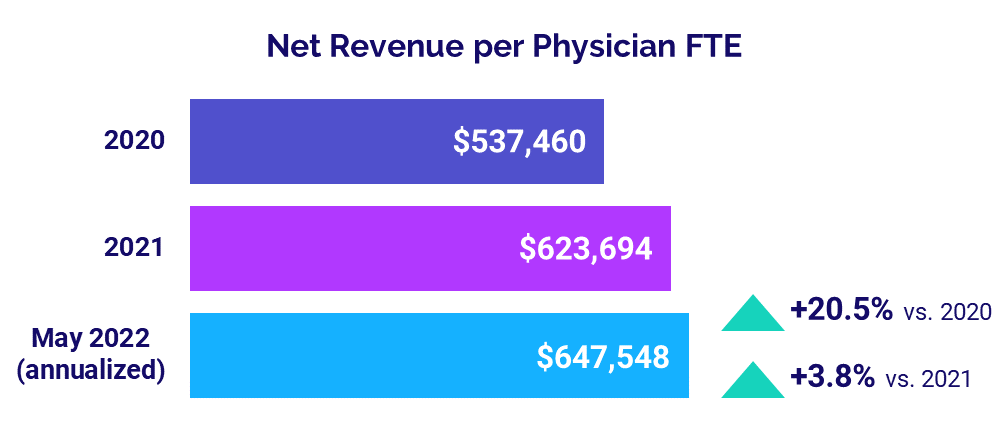
Physician revenues rose once again as practices saw increases in volumes and productivity. The median annualized Net Revenue per Physician FTE (including advanced practice providers) for May (annualized) was $647,548. That was a 3.8% increase from 2021 and a 20.5% jump from 2020.
Net Revenue per Physician FTE rose across all specialties compared to 2020 and 2021. Hospital-based Specialties had the biggest increase from 2021 at 9.2%, while Surgical Specialties had the least increase at just 0.6% over the same period.
The metric also increased for physicians across all regions from 2020 and 2021. Practices in the West had the biggest increases, with Net Revenue per Physician FTE up 7.3% from 2021 and up 27% from 2020.
Staffing Levels Slightly Above 2021
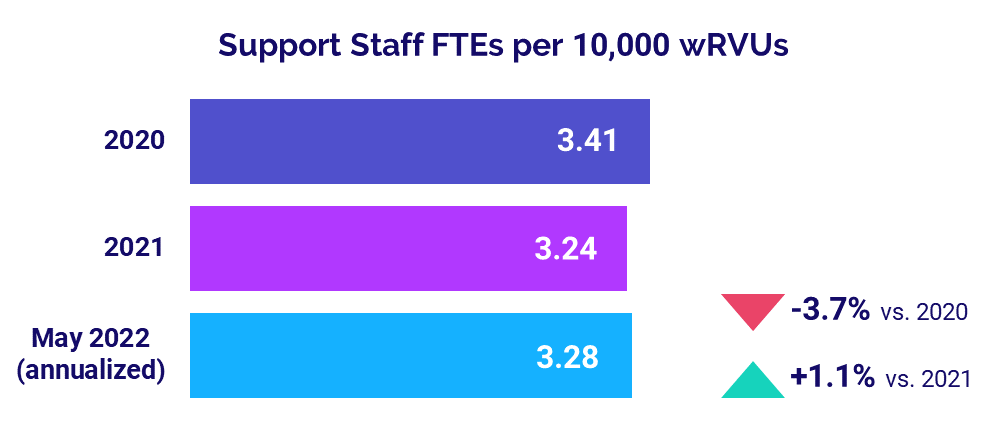
Median Support Staff FTEs per 10,000 wRVUs rose only slightly compared to last year, up just 1.1% to 3.28 in May (annualized). The metric was down -3.7% from 3.41 in 2020.
Support Staff FTEs per 10,000 wRVUs were mixed across different specialties. For example, the metric was down -2.0% from 2021 and down -7.8% from 2020 for Primary Care practices, but up 8.8% from 2021 and up 12.3% from 2020 for Surgical Specialty practices.
The Road Ahead for Healthcare
Healthcare providers nationwide are struggling to get a handle on rapidly rising expenses. As the costs of providing care continue to grow at a faster rate compared to revenues, hospitals, health systems, and other providers face unsustainable margin pressures. Overall care quality and access could be affected if these pressures persist.
Overcoming these challenges will require healthcare leaders to make difficult decisions. They must have a thorough understanding of costs and the various factors contributing to those costs organization-wide. They must understand how those costs impact other key performance indicators and specific service areas. This requires access to reliable data and analytics and the ability to model changes over time. With these capabilities, leaders are better able to anticipate future challenges and make informed decisions in shaping their organizations’ future course.
Source: Syntellis’ Axiom™ Comparative Analytics, which offers access to near real-time data drawn from more than 135,000 physicians from over 10,000 practices and 139 specialty categories, and from 500+ unique departments across more than 1,000 hospitals. Powered by Syntellis IQ, Comparative Analytics also provides data and comparisons specific to a single organization for visibility into how their market is evolving.

